Is Your Social Data Representative? A Framework for Evaluating Data Coverage
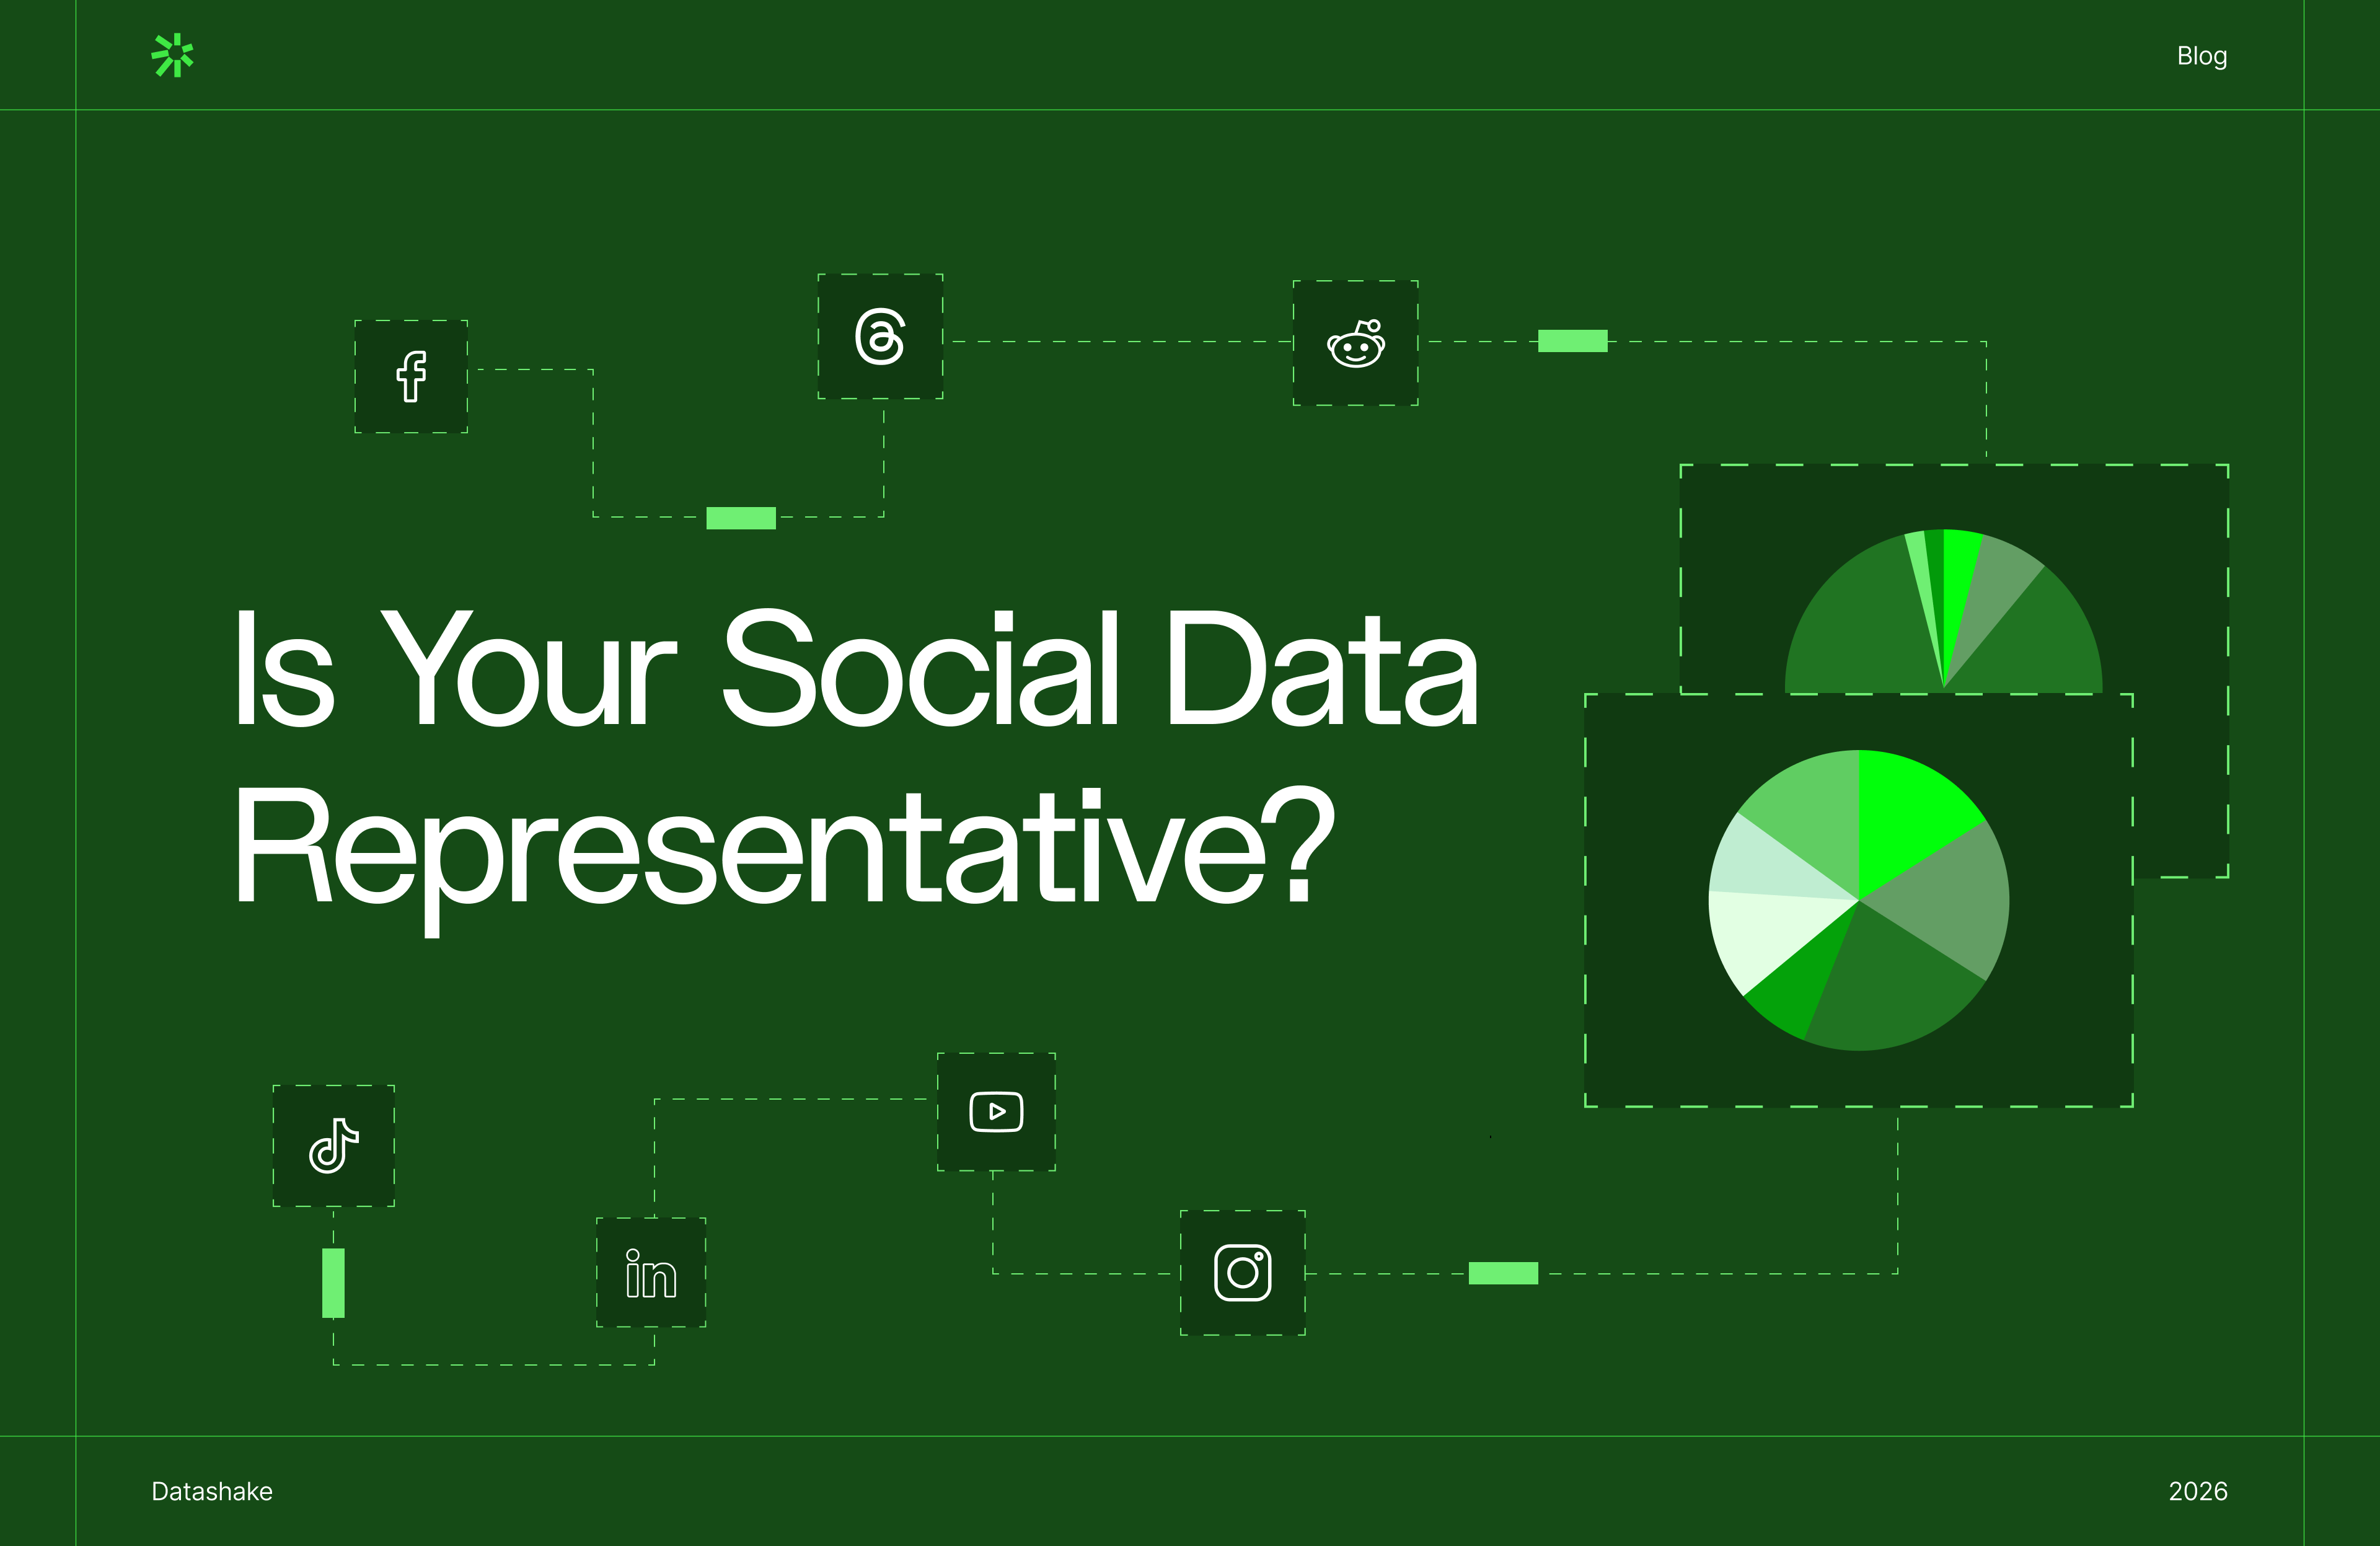
You're spending somewhere over $15K a year on social listening. Maybe more. More than 30% of professionals now use two or more tools, with the highest proportion of budgets falling in the $100K–$199K annual range.
That's serious investment. But what if the data powering your insights is structurally incomplete – and you don't even know it?
An estimated 82% of social media conversations about brands happen outside official channels. If you're not listening broadly – across platforms, content types, and time – you're deaf to most of the market. And many social listening tools were built on the foundation of free X/Twitter API access. That foundation has since crumbled, and the industry is still catching up.
"The APIs narrowed the focus and exposure of consumers to a stifling degree. The APIs now create an 'Observable Universe' of the internet, but as any astronomer knows, the difference between the Observable Universe and the actual universe is several orders of magnitude. This 'Observable Universe' issue is exacerbated as real consumers retreat into unobservable corners of the internet."
Russell Pinke, Head of Data Strategy at WKNY, writing in Brand Innovators
Access to online conversations is shrinking. But the tools built on that access don't always tell you it's getting smaller.
This post gives you a practical framework to find out for yourself – five steps to audit your social data for representativeness, so you can see exactly what you're missing and what it might be costing you. ⬇️
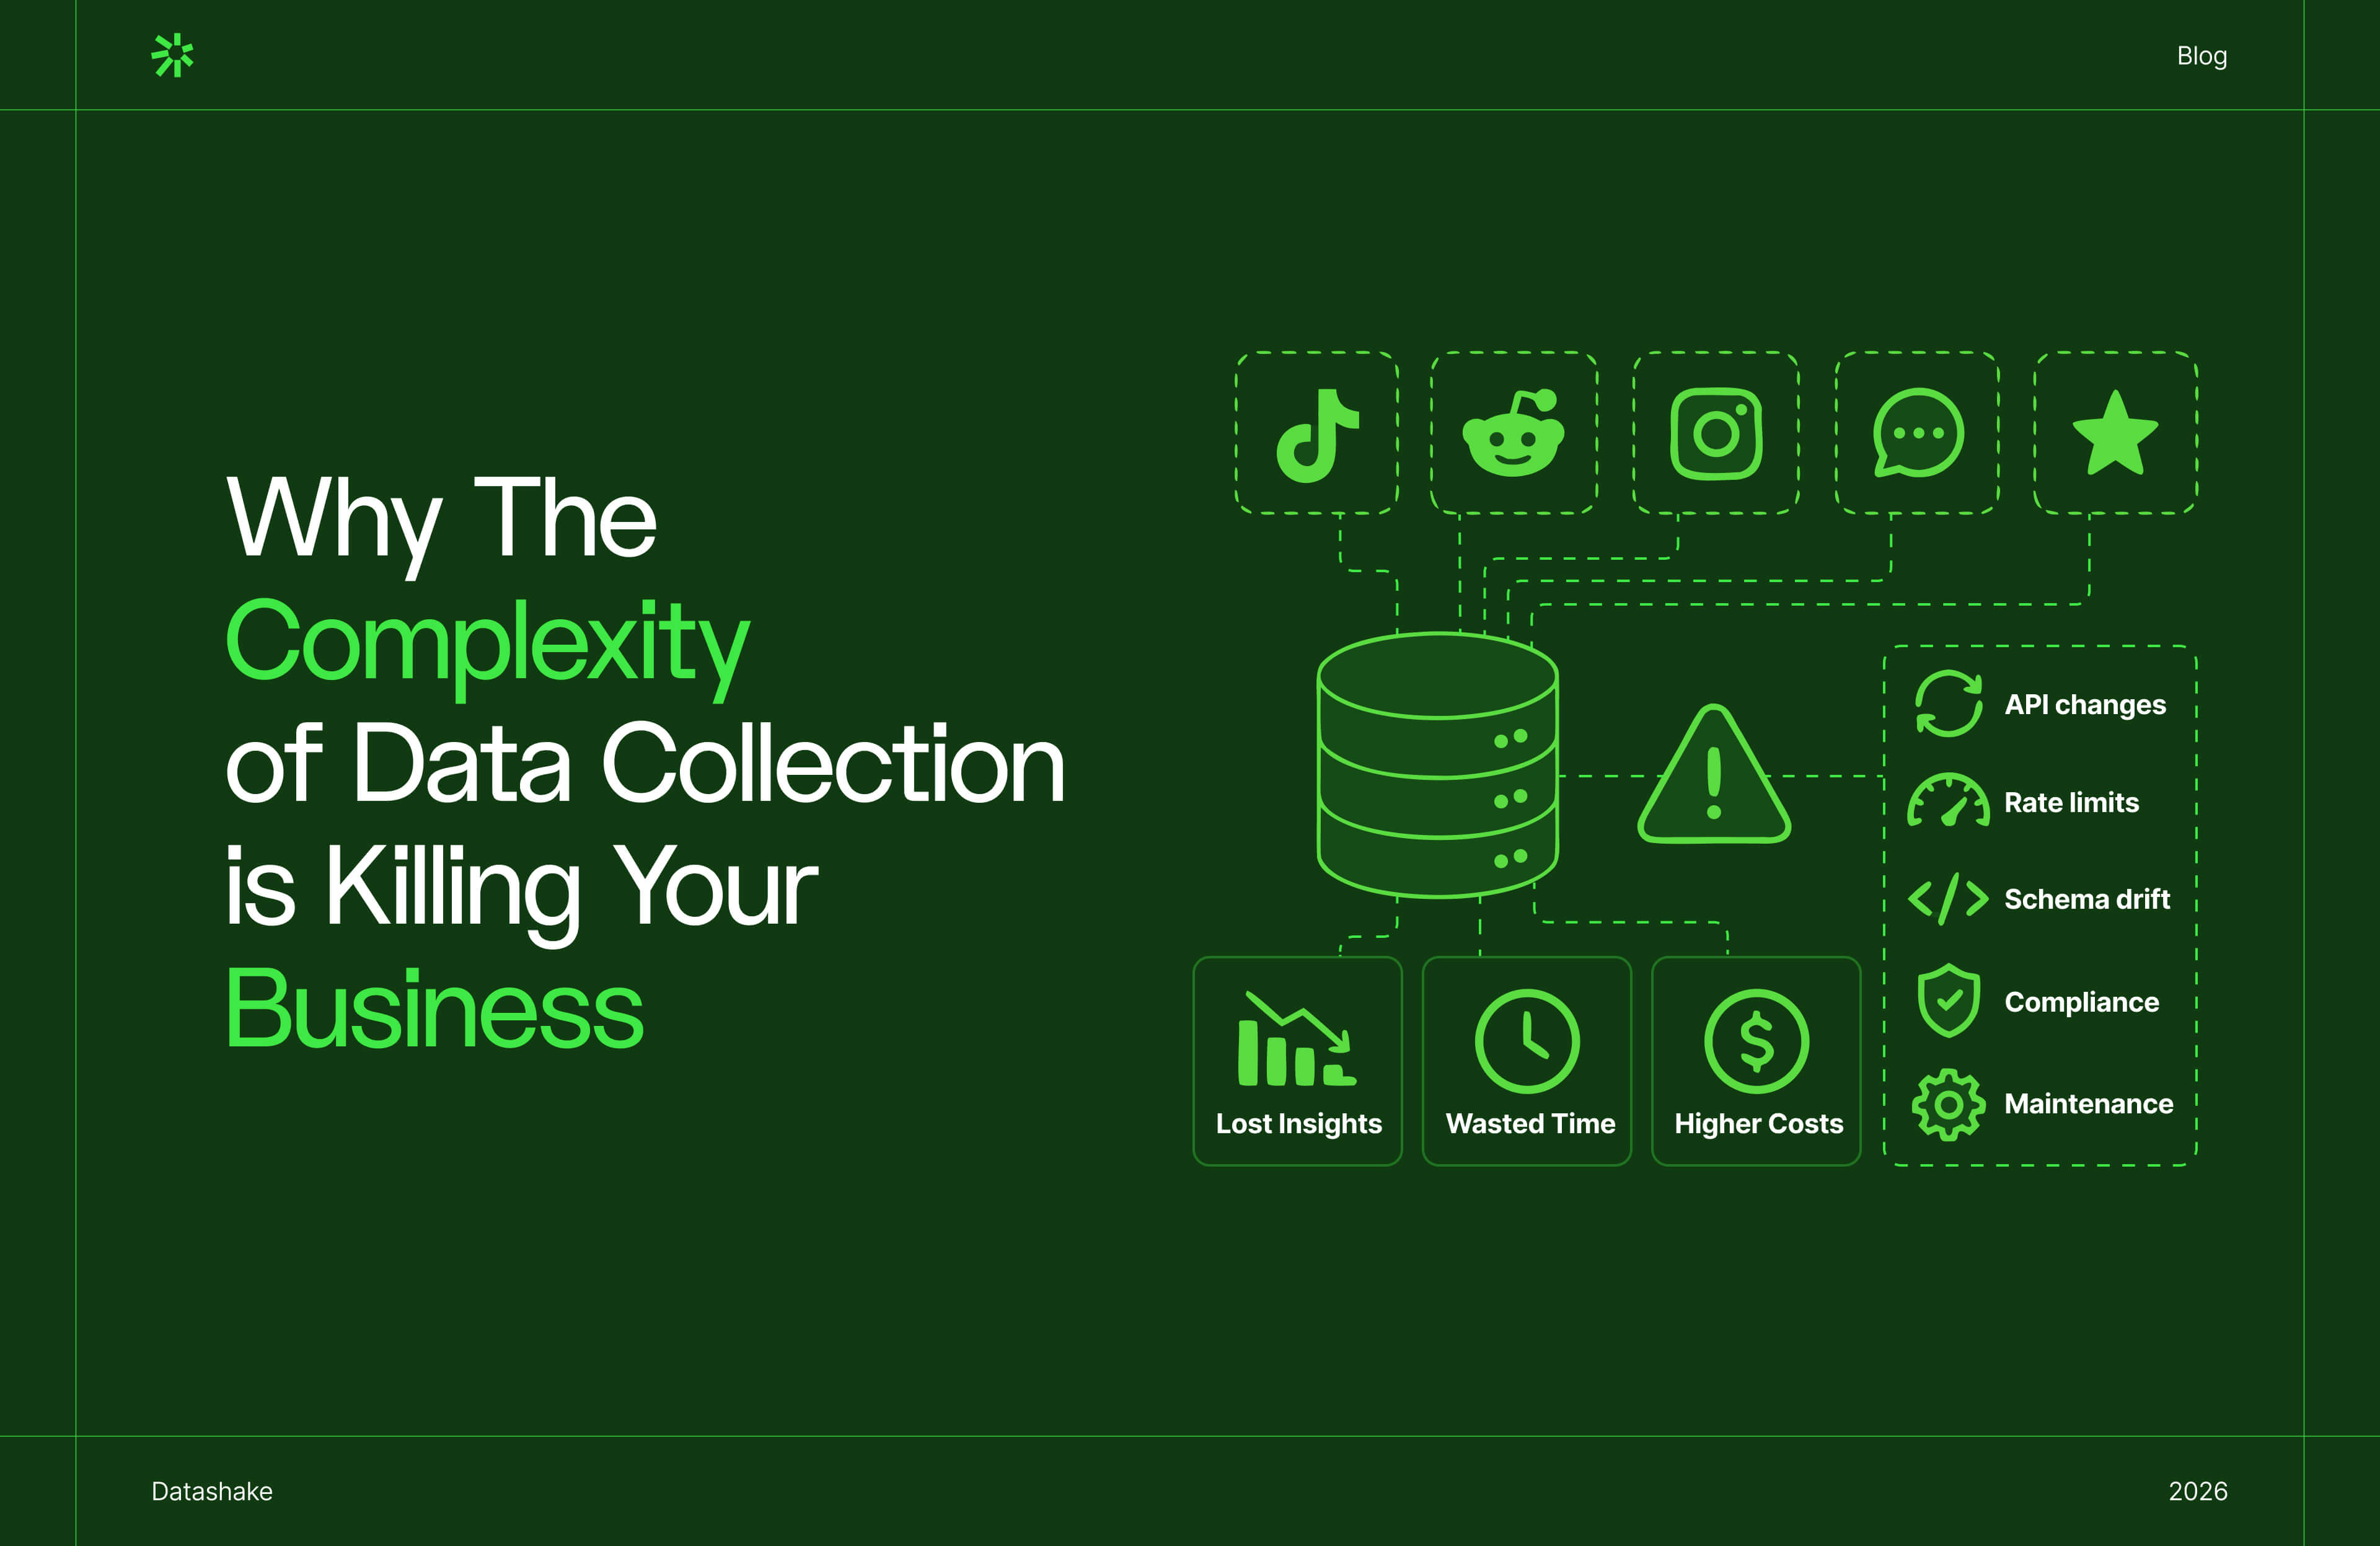
Why Coverage Isn’t What You Think It Is
It's standard practice in the industry to advertise coverage by the number of sources. 20 sources. 45 sources. 2 million web sources. These numbers sound impressive. But they don't tell you what you're actually getting from each source – or what's missing entirely.
The three true dimensions of coverages
.jpg)
Source breadth
Source breadth is the most visible dimension – how many platforms and source types are included. It's the number most vendors lead with.
But even here, the reality often falls short. Many tools still have significant gaps in their coverage of platforms like TikTok, Reddit, and Facebook. Some miss them entirely.
Data depth within sources
Data depth within sources is where things get interesting.
"Covering" a platform is not a binary thing. From each source, what data types do you actually receive? ⬇️
- Original posts
- Comments and replies
- Reels, stories, and video content
- Engagement metrics (likes, shares, views)
- Author information
- Timestamps
- Thread context and conversation structure
- Ratings and review scores
- Location and language data
- Hashtags and tags
- Reposts and shares (with attribution)
- Media attachments (images, links, embedded content)
There's a world of difference between capturing a brand post and capturing the 500 comments underneath it — especially when 100 of those comments are raising a product safety concern your tool never surfaced.
You need all of the types of data to understand the conversation. If you only have access to posts and not comments, you only have one side of the story.
Historical reach
Historical reach is the dimension most overlooked. How far back can you look? If you only have access to the last 30 days (or even the last 90) you have a snapshot of momentum. You can't grasp that a topic has been developing for years, or establish the baselines you need to distinguish a genuine trend from seasonal noise.
💡 For a deeper look at the specific mechanisms that cause social data gaps — from API throttling to content format shifts — read Why Your Social Media Data Is Incomplete.
You’re Only Hearing One Side of the Conversation
.jpg)
Every social media platform has a distinct user base, and vast differences in consumption preferences. Different ages, genders, income levels, political leanings, and communication styles.
If your data skews heavily toward one platform, it doesn't just mean you're missing some conversations. It means you're systematically oversampling certain demographics while missing others entirely.
According to Pew Research Center's 2025 survey of over 5,000 U.S. adults, platform demographics vary dramatically:
- YouTube reaches 84% of U.S. adults — the broadest of any platform, with strong usage across most age groups.
- Facebook is used by 71%, peaking among 30–49 year olds (80%) and skewing notably more female (78% of women vs. 61% of men).
- Instagram sits at 50%, but with a steep generational divide: 80% of 18–29 year olds use it versus just 19% of those 65 and older.
- TikTok is at 36% and rising, concentrated heavily among Gen Z and millennials, with the highest average daily usage of any platform at 47.3 minutes.
- Reddit has grown to 26% (up from 22% in 2023), skewing male, younger, and higher-income.
- LinkedIn reaches 30%, with 53% of users from high-income households — the platform where B2B evaluation actually happens.
- X (Twitter) sits at 21%, skewing male.
If your social listening tool was built on free X/Twitter API access (as most were), your data is overwhelmingly weighted toward X/Twitter's demographic: younger, more educated, higher-income, male-leaning, tech-focused.
So if you only have access to a part of the conversation, you could make decisions based on one extreme – on one side of the story. You're reading a thread, only reading the most engaged comment, but that's only one person talking out of a lot of people. You're missing an impactful part of the conversation.
"The current state of social listening is predominantly listening to Twitter, mostly just reading the captions, and only for very public channels/posts, which is dominated by AI"
How this distorts your analysis
.jpg)
False trends
A topic dominating one platform may barely register on another. Without cross-platform visibility, you mistake a platform-specific echo chamber for a broad market signal, and allocate resources accordingly.
Missed perspectives
The conversation about your brand on TikTok and Instagram can look completely different from the conversation happening on X. If you only have access to one, you don’t know what people think. You know what one demographic thinks, on one platform, in one format.
Cross-platform opinion divergence
A polarizing public figure posts something on Twitter, and the conversation there looks completely different from what's happening on TikTok and Instagram. If you only have access to one platform, you can think the country's opinion is different than it actually is.
Late crisis detection
Issues typically emerge in niche communities – Reddit threads, TikTok videos, patient forums – before migrating to mainstream platforms. If your monitoring is concentrated on X or Facebook, you're catching crises after they've escalated, not before. The difference between catching an issue at emergence versus mainstream awareness can be 12 to 48 hours. In a crisis, that's everything.
Regulatory exposure
Incomplete social monitoring is a compliance risk for regulated industries.
Pharmaceutical companies, for example, are expected to monitor digital channels for adverse event reports. The EU's Good Pharmacovigilance Practices (GVP Module VI) requires marketing authorization holders to regularly screen for suspected adverse reactions on digital media. If your monitoring only covers a fraction of the platforms where patients discuss side effects, you're exposed.
Bot-contaminated signal
Some platforms are significantly more bot-infested than others. Bots now account for nearly 50% of all internet traffic, and on certain social media platforms, automated accounts inflate engagement metrics, simulate fake conversations, and distort sentiment at scale. If your data is concentrated on a heavily bot-affected platform, you may not be hearing real people at all.
And AI only amplifies the problem
There's a tempting assumption in the market right now: that better AI will compensate for data gaps. That if the analytical layer is sophisticated enough, the quality of the underlying data matters less.
The evidence says otherwise.
➡️ MIT's Project NANDA found that 95% of generative AI pilots fail to progress beyond experimentation, and the primary reason isn't the models. RAND Corporation research puts the broader AI project failure rate at over 80%: twice the failure rate of non-AI technology projects.
Organizations invest in increasingly powerful analytical tools, then feed them incomplete or skewed data and realize the outputs don't hold up.
In social listening, this problem has a specific shape. AI-powered sentiment analysis models learn from the data they're trained on. When that data overrepresents one platform's demographic (which, as we've seen, is common) the model learns that demographic's communication patterns, slang, emotional expression, and cultural context as if they represent the whole market.
Recent research in Frontiers in AI found that when training data contains unevenly distributed sentiment categories or linguistic styles, LLMs "inherit and amplify those patterns, leading to skewed or unreliable sentiment predictions." The model doesn't flag the gap. It just produces confident outputs – fast, at scale, and potentially wrong.
And the problem is getting worse. AI-generated content now accounts for more than half of all English-language content on the web. Meltwater reported that mentions of "AI slop" increased ninefold in 2025. Bots generate posts, other bots engage with them, and the result is a rising tide of synthetic signal that social listening tools dutifully capture and analyze as if it were genuine human conversation.
The very real risk ➡️ the analytical layer is getting more sophisticated at exactly the moment the data layer is getting noisier and less representative. Better AI doesn't fix this. Better input data does.
How to Audit Your Social Data in 5 Steps
If you've read this far, you're probably wondering what your own data actually looks like. Here's a practical diagnostic — five steps that will reveal whether your social data is representative enough for the decisions you're making with it.
.jpg)
1️⃣ What percentage of your total data comes from each source?
2️⃣ From the sources you do cover, are you getting everything?
3️⃣ From each mention or data point, what information do you actually receive?
4️⃣ How far back can you look?
5️⃣ How much do these gaps actually matter for YOUR specific decisions?
✅ Step 1: Check your source distribution
.jpg)
The question: What percentage of your total data comes from each source?
Ask your provider for a source distribution breakdown. Calculate the percentage from each platform.
⚠️ The red flag: If any single source exceeds 50% of your total data volume, your insights are systematically skewed toward that platform's demographic, geographic, and topical biases.
If your vendor can't or won't produce this breakdown, that's a red flag in itself. It means they either don't track it, don't want to show it, or their system doesn't support that level of transparency.
What you'll commonly find: legacy social listening tools often show 80–95% X/Twitter concentration, a hangover from years of free API access. Platform-specific tools show 100% concentration by design. More modern multi-source approaches tend to keep any single source below 30–40%.
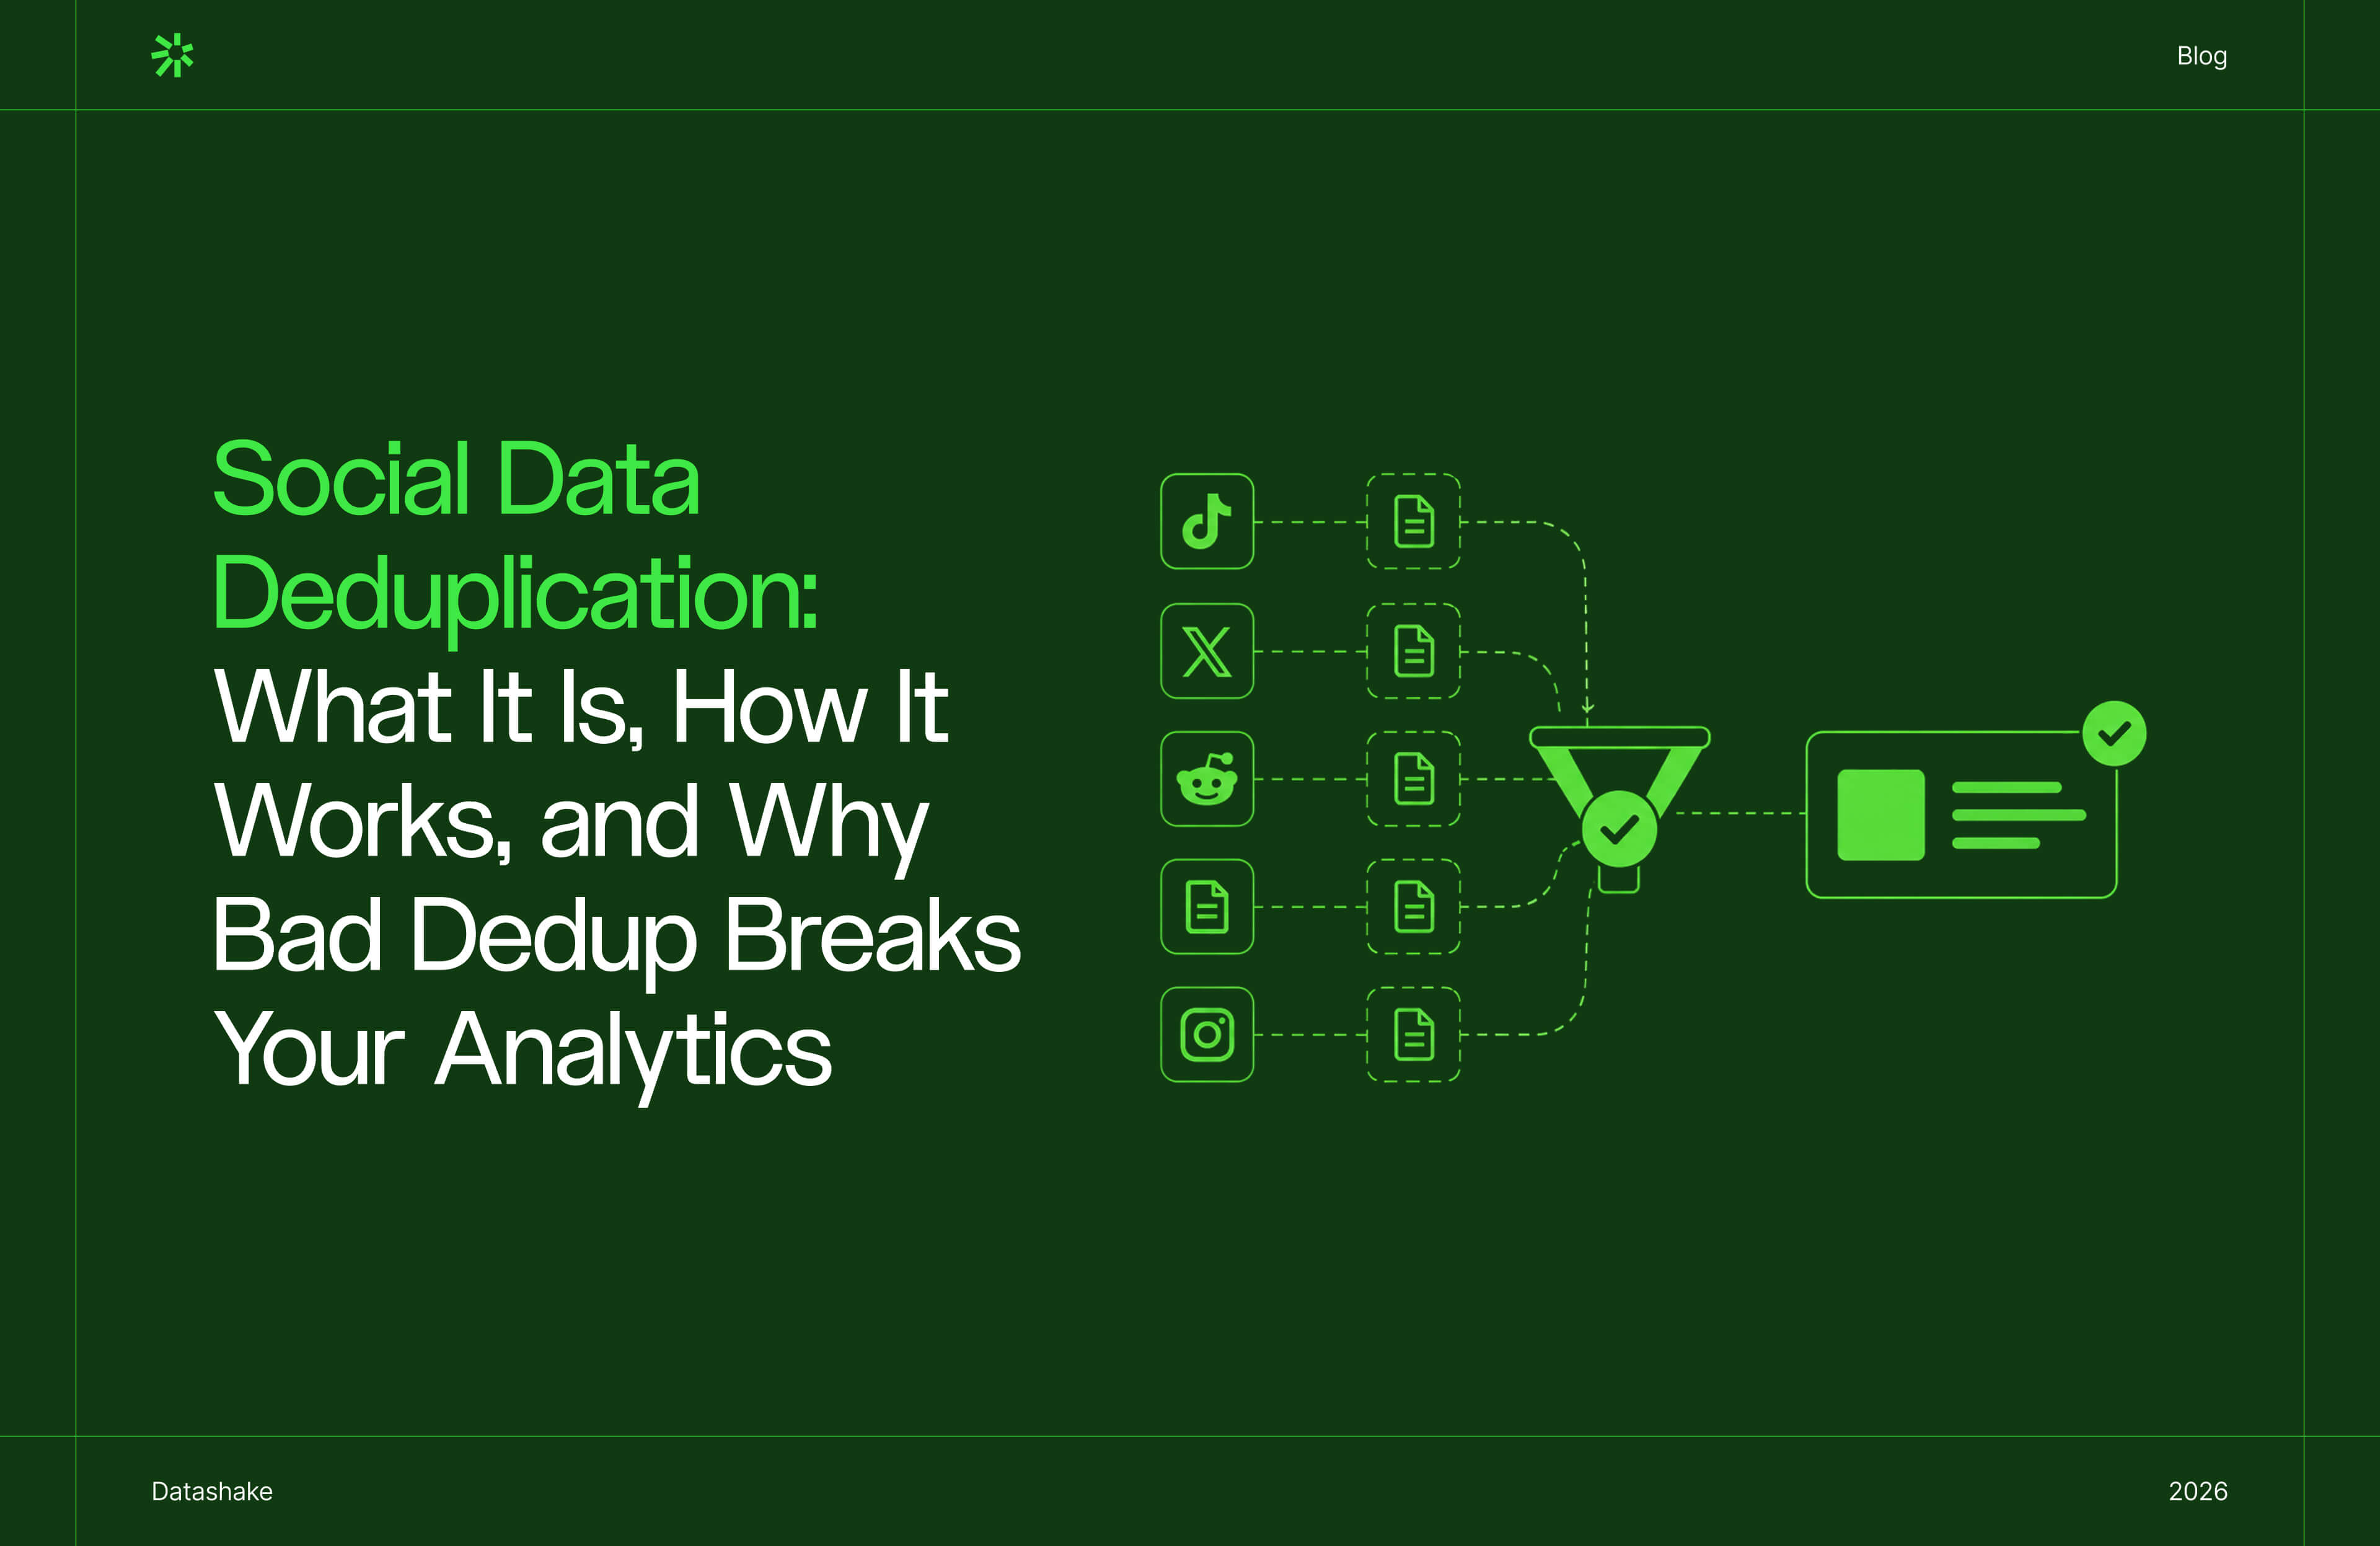
✅ Step 2: Test your data completeness within sources
The question: From the sources you do cover, are you getting everything?
Coverage isn't a checkbox. It's a spectrum. For each platform in your setup, check what content types you're actually receiving. Posts only? Or also comments, replies, reviews, reels, stories, and reposts?
This matters more than most people realize. A brand post with 500 comments contains a conversation. That conversation might include early signals of a product issue, shifts in sentiment, or perspectives that contradict the original post entirely. If your tool only captures the post, you've got a headline without the story.
How to test it
Pick a topic you're currently monitoring. Log into two or three platforms natively – Instagram, Reddit, TikTok – and search for it manually. Compare what you see on the platform versus what shows up in your tool. Note any content types that are missing. This exercise takes 30 minutes and the findings are often eye-opening.
✅ Step 3: Assess your metadata richness
Question: From each mention or data point, what information do you actually receive?
Beyond the content itself, metadata is what turns raw mentions into meaningful insights. Check for:
- Author name or handle
- Full text (not truncated)
- Timestamp
- Engagement metrics (likes, shares, replies, views)
- Connection to the parent post or thread
- Hashtags and tags
- Location and language data
- Platform of origin
Without engagement metrics, you can't distinguish a fringe opinion from a widely shared one. Without thread context, you can't understand the conversation arc – a reply disagreeing with a viral post is just as important as the post itself. Without timestamps, you can't track how fast something is spreading.
How to test it
Export a sample dataset from your current tool. Check each data point for the metadata fields above. If fields are consistently empty or missing, that's a completeness gap affecting every analysis you run.
✅ Step 4: Measure your historical depth
The question: How far back can you look?
If you only have access to the last few weeks of data, you can see what's happening now. You can't see how you got here. You can't establish baselines, identify seasonal patterns, understand how a trend developed over months or years, or conduct meaningful post-mortems on past crises.
How to test it
Pick a topic your organization has tracked for a while. Try to pull data from 12 or more months ago. If you can't — or if the data thins out dramatically beyond a few weeks – that's a historical depth limitation shaping every trend analysis and benchmark you produce.
✅ Step 5: Map it to your use case
The question: How much do these gaps actually matter for YOUR specific decisions?
Not all gaps carry equal weight. The final step is evaluating what you've found against the decisions you're actually making with this data.
A financial services firm focused on due diligence might not need TikTok data — but a CPG brand absolutely does. A pharmaceutical company monitoring for adverse events needs every platform where patients discuss side effects, and that increasingly means TikTok, Reddit, and patient forums, not just X. An agency managing a portfolio of diverse clients needs broad, platform-agnostic coverage by default.
How to apply it
Map your top three business use cases for social data. For each one, identify which platforms and data types are critical. Then cross-reference with what your current setup actually provides. The gap between "what I need" and "what I have" is your coverage risk – and the starting point for a more informed conversation with your data providers.
💡 If this gap analysis has you weighing whether to build a data pipeline internally or work with a provider, we break down the real costs — including the ones that don't show up in year one — in Should You Build or Buy Your Social Media Data Pipeline?
Final Thoughts
Official platform APIs are becoming more restrictive. Over the course of 2023 alone, X, TikTok, and Reddit all made substantial changes to their APIs – reducing access or significantly increasing charges.
- TikTok's API remains gated behind registration and approval processes
- Reddit introduced restrictive rate limits and began charging for access
- Meta's platforms have become less willing to share data with vendors, citing privacy concerns.
At the same time, the content formats that dominate social media are shifting away from what most tools can analyze. Video content (TikTok, Reels, Stories) has become the primary mode of communication on many platforms. But most social listening tools still primarily analyze text captions.
And then there's AI-generated content flooding platforms with synthetic noise, making it harder to separate genuine human conversation from automated slop. This drives real users into more private, harder-to-monitor spaces — further shrinking the "observable universe."
Organizations that rely on a single approach to data access (especially pure API dependency) are increasingly exposed.
So the question is whether your social data is representative.
Representative social data isn't about volume. It's not about having "more" data. It's about having balanced, complete, deep data from across the full conversation landscape: multiple platforms, multiple content types, full metadata, historical depth, and the flexibility to access it in the way your specific use case requires.
The audit framework above takes a few hours to run. The insights it reveals can reshape your entire data strategy.
Ready to see what your current setup is missing? Book a demo — we'll walk through your specific use case and show you what comprehensive, representative social data looks like.


More insights you might like
%20Get%20in%202026%20Thumbnail.jpg)