How to Spot Customer Churn Signals in Reviews (Before Your Dashboard Does)
%20thumbnail.jpg)
Customer churn rarely comes out of nowhere. By the time someone cancels, the decision was made weeks, sometimes months earlier.
Yet your churn detection stacks is probably catching this too late. Health scores track login frequency and feature adoption: by the time usage drops noticeably in your dashboard, your customer has already emotionally checked out.
There's a signal layer you could be tapping into to quickly pick up on churn signals: public customer reviews. Because customers write them honestly, on third-party platforms, weeks before your product telemetry picks up anything unusual.
But how do you spot customer churn signals in customer reviews?
This post covers what review-based churn signals look like, what each one means, how they escalate over time, and what to actually do when you spot them. ⬇️
Quick answer: What are churn signals in customer reviews?
Churn signals in customer reviews are patterns in language, sentiment, volume, and cross-platform behaviour that indicate a customer is at risk of cancelling. They typically appear 4-8 weeks before the decision becomes visible in product usage data. Key signals include competitor mentions, sentiment drift toward neutral, declining review volume, high-risk language clusters (pricing, disappointment, complexity), and multi-channel convergence on the same friction theme.
Why customer churn signals appear in reviews 4-8 weeks before your dashboard
If your health score, NPS survey, and usage dashboard are all green; does that mean your customers are staying? Not necessarily.
Your churn stack measures consequences, not causes
Every tool in the standard prevention stack (health scores, NPS surveys, usage dashboards, billing alerts) has something in common: they all measure what a customer has already done. None of them measure what a customer is thinking about doing.
By the time a health score drops, the friction causing that drop has been building for weeks. The customer's emotional decision to leave comes first, the behavioural evidence follows. Your data captures the consequence but it misses the cause.
The tools that are supposed to catch churn early often don't
Here's how the most common signals perform:
- NPS surveys – point-in-time snapshots, sent on a schedule, from customers who bother to respond. The customer who scored you 8 last quarter and has since quietly decided to leave won't show up as at-risk until the next survey cycle, if they respond at all.
- Health scores – aggregations of usage behaviour. They tell you a customer is disengaging, but only after the disengagement has been happening long enough to register. By the time the score turns amber, the decision is often already made.
- Usage dashboards – same problem. Login drops and feature attrition are symptoms of a decision, not signals of one forming.
- Billing alerts – useful for catching involuntary churn, but blind to voluntary churn until a payment failure or cancellation has already occurred.
None of these are useless, they're just reading the wrong layer of the story. They tell you what happened. Review data tells you what's happening.
Why timing is everything
The timing data makes this concrete:
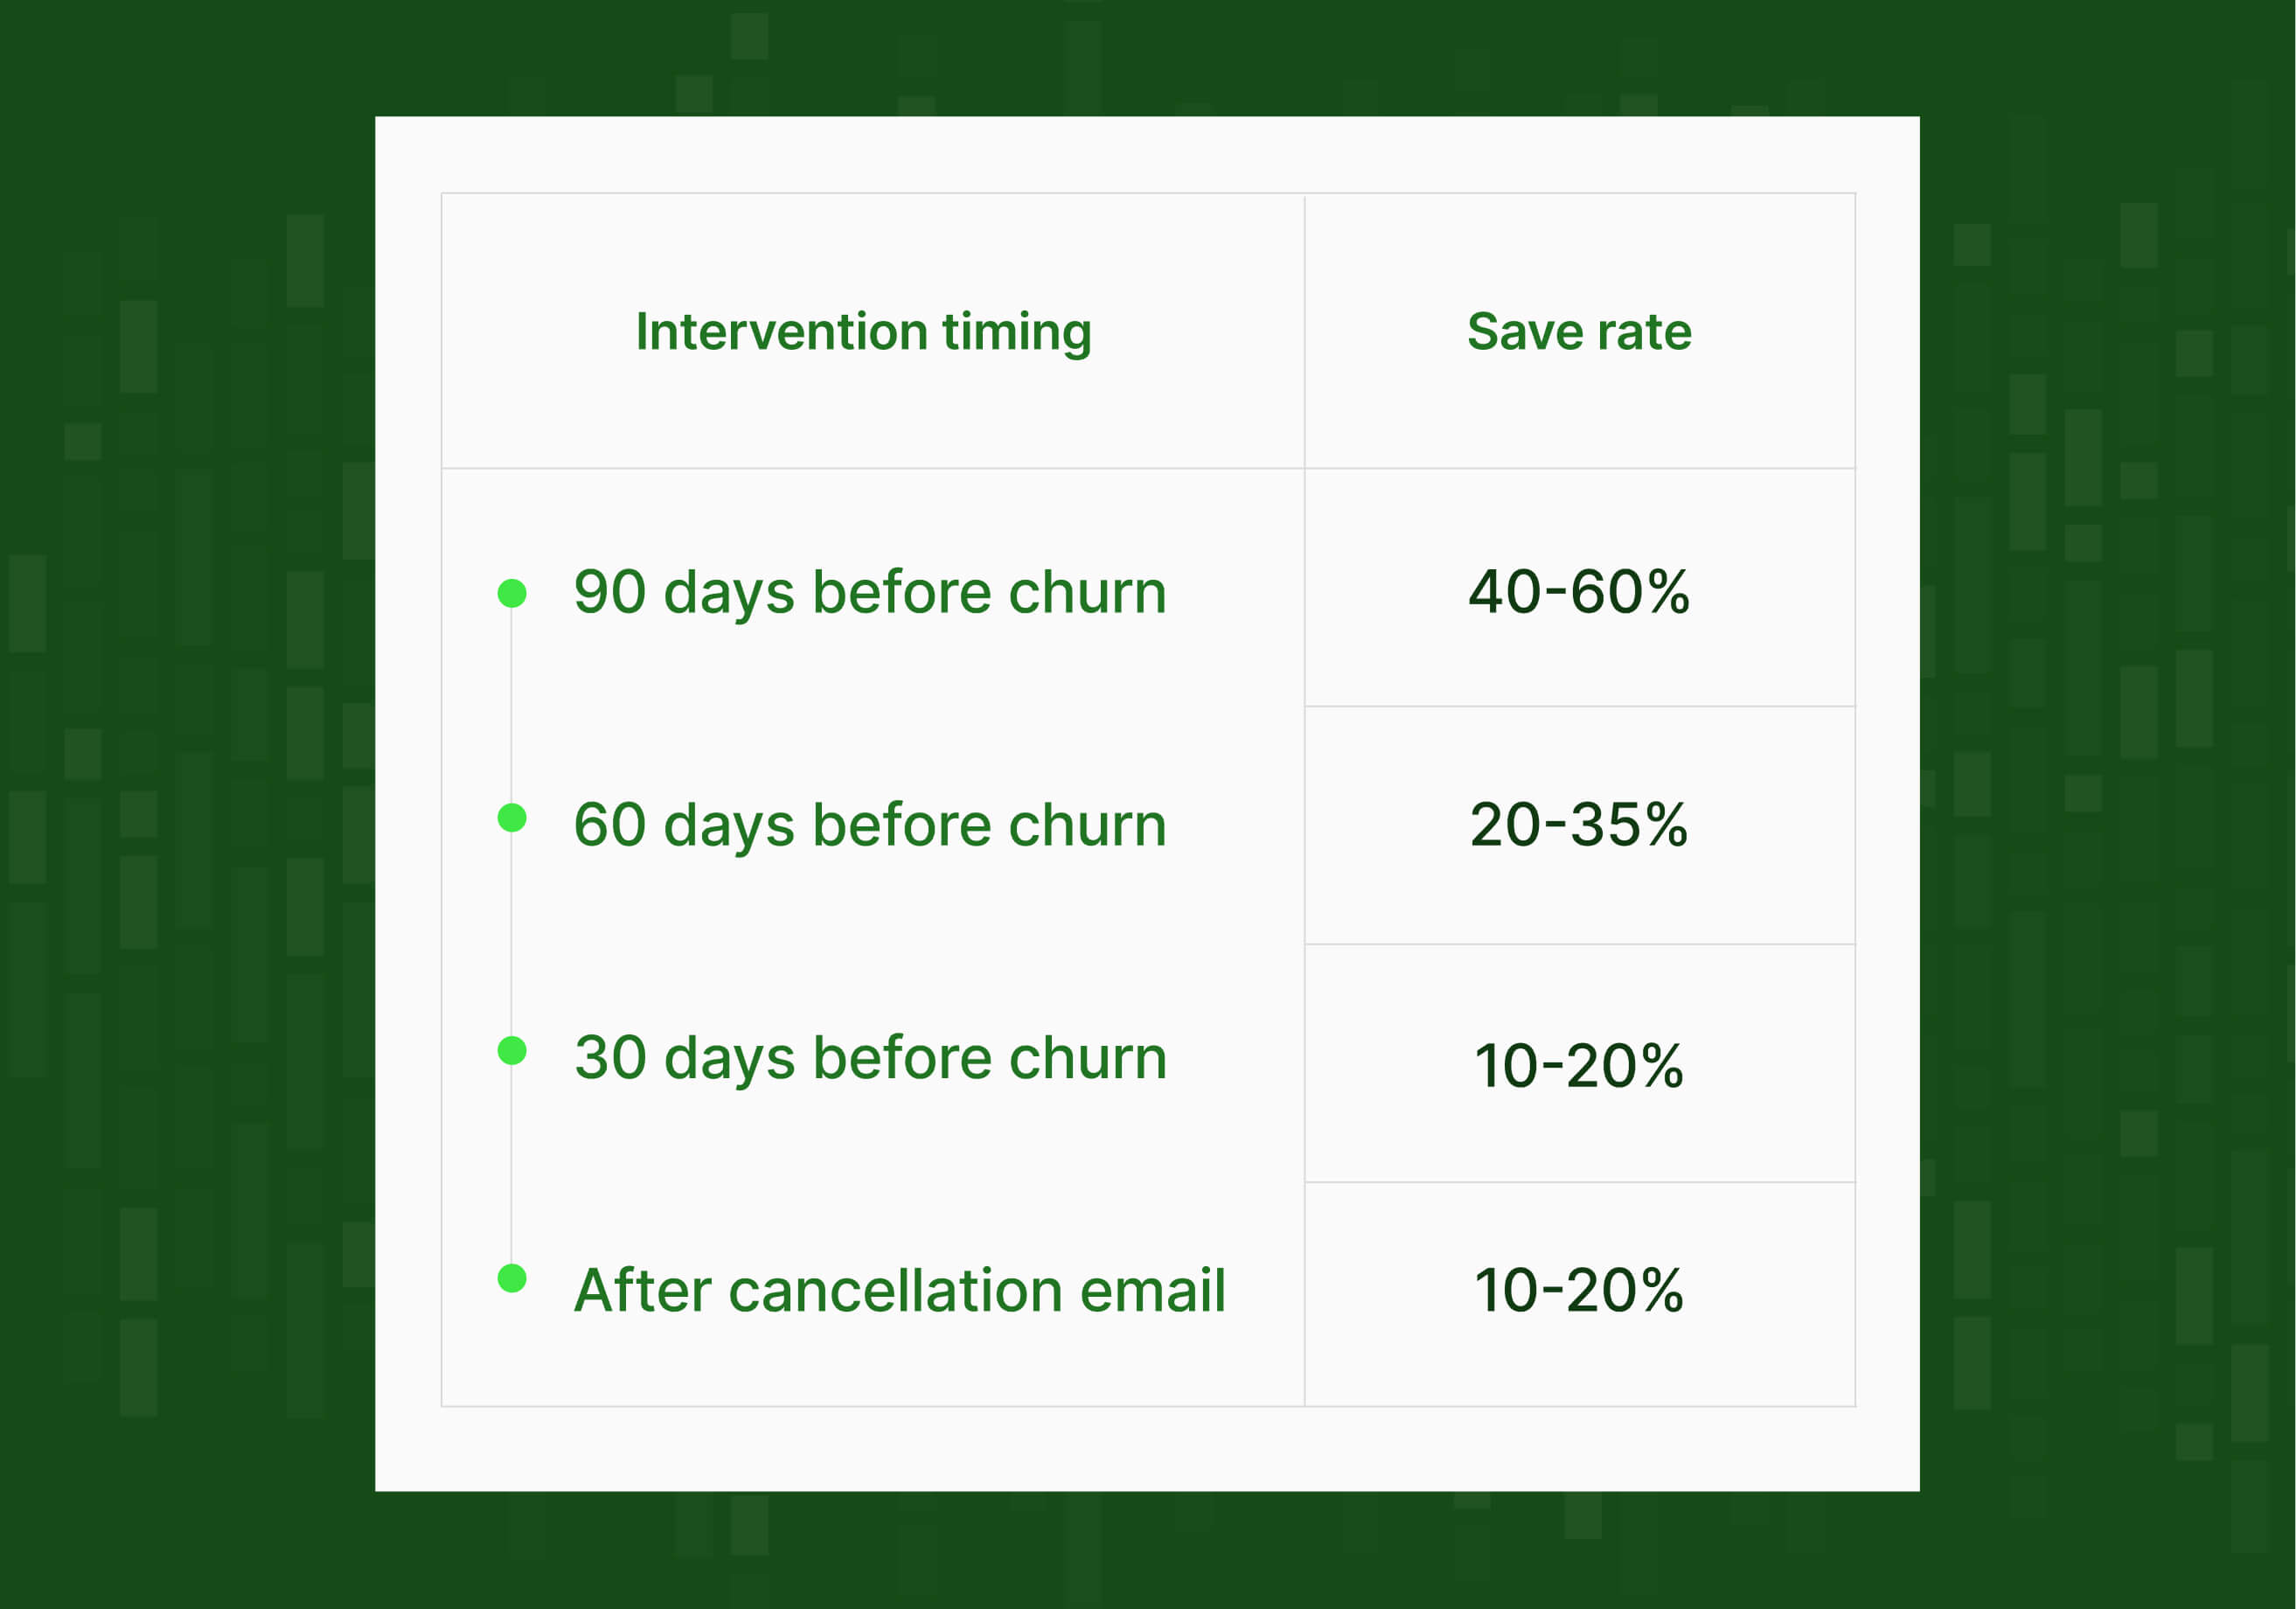
Source: Churn Risk Detection: Early Warning Systems for Proactive Intervention
The window where you can still save a customer relationship closes fast. Which means the value of any signal isn't just whether it's accurate, it's how early it arrives.
Feedback-based churn signals typically appear 4-8 weeks before CS health scores reflect the same pattern. Review data sits in that earlier window because customers write public reviews when they want other buyers to know what they truly think: candidly, on third-party platforms that your internal dashboards have no direct visibility into.
That combination (external, candid, earlier than behavioural data) is what makes public review monitoring one of the highest-leverage additions to an existing churn stack.
The 5 churn signals hiding in customer review data
What churn signals should you look for in customer reviews?
You're not hunting for one-star takedowns. You're looking for patterns in language, sentiment direction, volume, and cross-platform overlap: tracked over time, not read at a single point.
Here are the five most reliably predictive signals.
1. Competitor mentions in reviews: the strongest churn signals
When a customer names a competitor in a review, they're no longer just unhappy, they're actively comparison-shopping. Research shows customers who mention a competitor by name in their feedback churn at 4x the baseline rate within 60 days. That's a customer with one foot out the door.
This signal intensifies when it appears alongside a pricing complaint or a feature gap mention. A review that says "competitor X has this built in and it actually works" is essentially a departure announcement with a 60-day notice period.
Worth noting: even seemingly positive comparative mentions ("I've been looking at X and Y, both seem solid") are comparison-shopping signals. The customer is conducting due diligence. They've already mentally opened the exit door.
In March 2026, G2 validated exactly this when they launched Competitive Pulse, a product built specifically to surface "Churn Threats" by flagging when existing customers show increased engagement with competitor pages on the platform. One of the world's largest B2B review platforms built a churn detection product on this exact signal. That's not a hypothesis. It's market validation from a platform processing over 200 million annual software buyers.
What to do about this churn signal
Flag any review or forum post where a named competitor appears alongside your product. Competitive mentions predict churn within 90 days in 40–60% of cases. Route to CSM within 48 hours.
2. Neutral sentiment, more dangerous than negative reviews
Neutral sentiment is a customer's review rating drifting toward 3 stars from previously higher scores, or language that describes your product as adequate rather than valuable.
It’s the most counterintuitive finding in churn research. The customers posting one-star reviews are frustrating, but they're engaged. They still care enough to be angry. The shift from anger to indifference is the most dangerous moment in the customer relationship.
👀 "Does the job." "It's fine." "Nothing special." These are the customers deciding that staying isn't worth the effort. They're not escalating because they've already concluded that nothing will change.
Customers who say "it's fine" across multiple touchpoints while gradually disengaging (login frequency dropping, fewer features used, shorter sessions) are higher churn risks than customers who complain loudly but remain active. The loud ones can still be won back. The quiet ones have usually already made their decision.

What to do about this churn signal
Track review trajectories, not individual scores. A customer moving from 8/10 → 6/10 → 4/10 is more urgent than one sitting stable at 5/10. A drop of 2 or more points across consecutive touchpoints is a meaningful threshold worth routing to CS.
3. Review silence: why customers who stop complaining are your highest churn risk
Review silence means a previously active reviewer stopping all public engagement – no new reviews, survey responses, or forum activity.
A 2024 study published in the Journal of Service Research analysed over 840,000 customer interactions and found that communication cessation (not complaint frequency) is the most reliable churn predictor, across both B2B and B2C contexts.
The base rate makes this urgent: only 1 in 26 unhappy customers actually complains, the other 25 leave without a word. For every complaint visible in your review data, there are roughly 25 at-risk customers saying nothing. ⚠️
Customers who stop complaining are 3.2x more likely to churn within 30 days than customers who are still actively frustrated. So a drop in review volume from a previously active cohort is a warning.
What to do about this churn signal
Track review velocity alongside review content. Flag accounts where public engagement has dropped significantly over a rolling 30-day window without a corresponding satisfaction event. Trigger a soft re-engagement sequence: a product update, a roadmap share, or a light-touch CS check-in.
4. High-risk language patterns in customer reviews
Some specific words and phrases in review text are linked to measurably higher churn probability within a defined timeframe.
Phrases like "disappointed," "not what I expected," and "too complicated" appearing across multiple conversations correlate with a 70% higher likelihood of churn within 60 days.
Pricing language is a value signal, not a budget signal, and that changes what you do about it. When a customer says your product costs too much, they're rarely making a budget argument. What they actually mean is: "I can no longer justify what I'm paying for what I'm getting." The price hasn't changed, their perception of what it buys them has.
That distinction makes a difference in how you respond. A discount won't fix it – a conversation about ROI, a use case review, or a demonstration of value they haven't tapped into yet might. The customer isn't asking you to be cheaper, they're telling you they've stopped seeing the return.
High-churn language patterns to monitor

What to do about this churn signal
Set cohort-level thresholds, not just keyword alerts. The signal is in the proportion of feedback containing these clusters, not in individual instances. When the proportion of pricing-related language doubles within a segment, treat the segment as high-risk.
5. Tonal flattening in reviews
Tonal flattening is the gradual draining of specificity, enthusiasm, and forward-looking language from a customer's public feedback – even when the rating itself hasn't dropped significantly.
Emotional signals lead behavioural signals by 1–2 weeks. A customer decides to leave emotionally before they act on it, before:
- Logins drop
- Feature usage declines
- The renewal conversation goes cold.
Tonal flattening in reviews captures this emotional pre-decision phase, but usage dashboards don't.
What it looks like in practice: a customer's reviews shift from specific and forward-looking ("I'd love to see X added, the product is getting better") to vague and present-tense ("it works"). Language gets shorter, specificity disappears. The emotional investment drains out of the writing.
A customer whose sentiment drops by 2 or more points across consecutive touchpoints is at higher churn risk than one who has consistently scored 5, regardless of where they started. The trajectory is the signal, not the score.
What to do about this churn signal
Monitor sentiment direction over time, not just sentiment value. NLP-based review monitoring can surface this automatically at scale; manual reading can't.
How churn signals escalate
Churn doesn't switch on, it accumulates. And because it follows a recognisable pattern, knowing where a customer sits in that pattern changes what you should do about it.
Analysis of B2C subscription data shows customers who eventually churn display measurable sentiment decline starting 4–8 weeks before cancellation. That decline moves through three distinct phases, each with different signals and a very different intervention window.
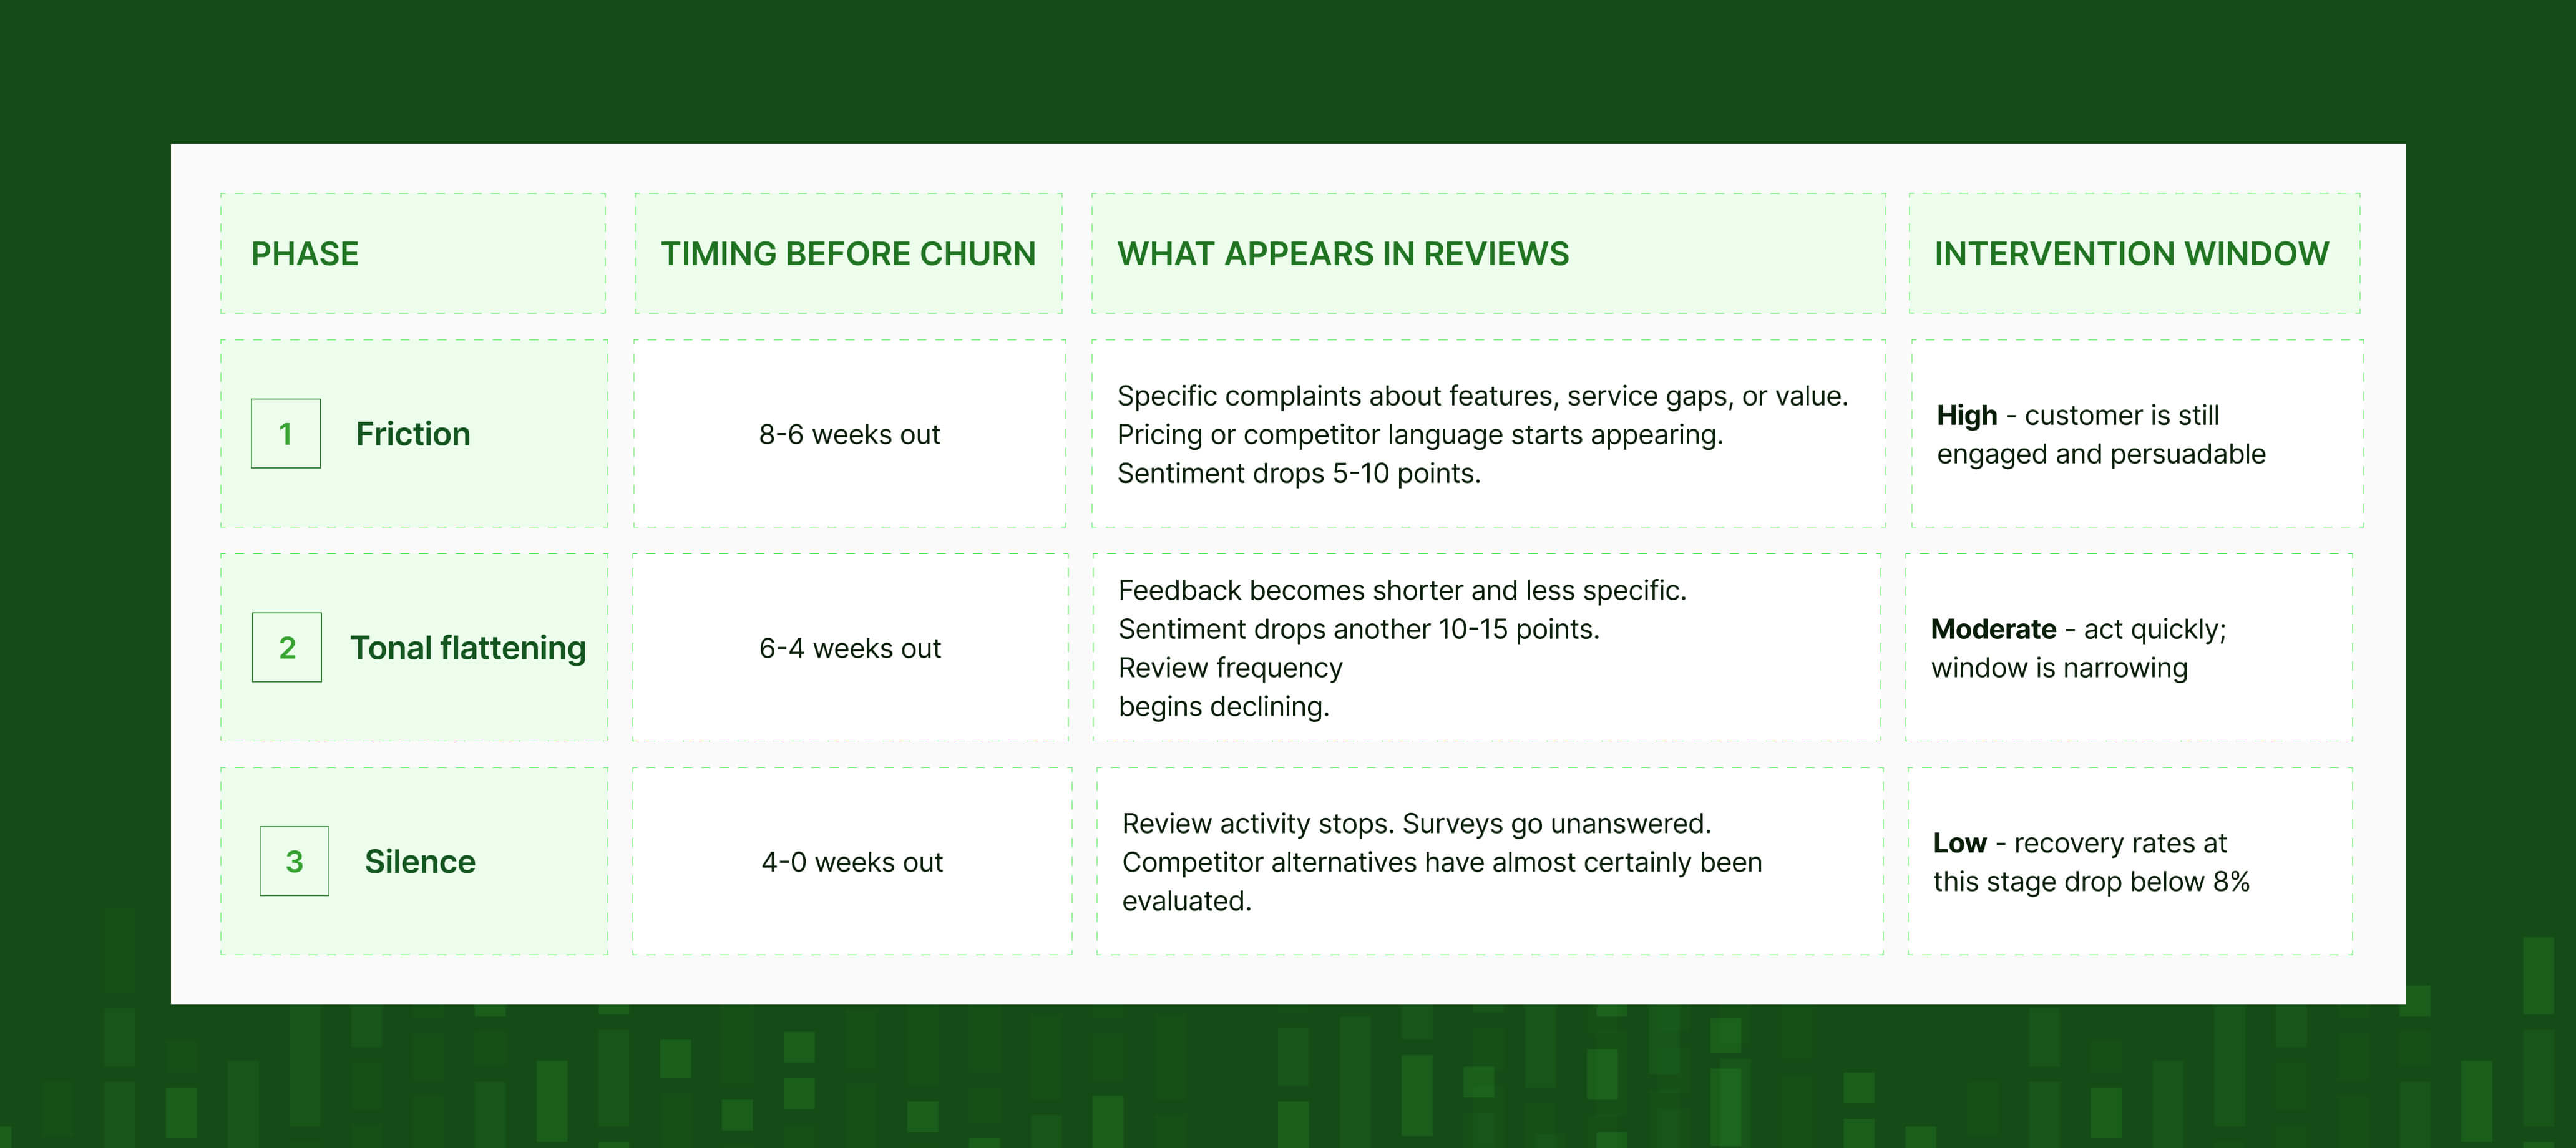
🟢 Phase 1: Friction (8-6 weeks before churn)
This is where review data gives you the most lead time.
Feedback becomes specific: complaints about a particular feature, a support experience that went badly, a price increase that doesn't feel justified.
Sentiment drops 5–10 points. Pricing language starts appearing. Competitor mentions surface for the first time.
The customer is still engaged. They're frustrated, not resigned. This is the phase where a well-timed CS conversation is most likely to change the outcome, which makes it the highest-value detection window.
🟠 Phase 2: Tonal flattening (6-4 weeks before churn)
Something shifts. The complaints get less specific, reviews get shorter. The emotional investment drains out of the language, and frustration gives way to indifference. Sentiment drops another 10–15 points. Review frequency starts declining.
This phase is harder to catch precisely because it's quieter. The customer is withdrawing. Intervention is still possible here, but the window is narrowing fast. A check-in that felt proactive in phase 1 starts to feel reactive in phase 2.
🔴 Phase 3: Silence (4-0 weeks before churn)
Review activity stops, and surveys go unanswered. The customer has almost certainly evaluated alternatives by this point. Recovery rates at this stage drop below 8% regardless of what intervention is attempted.
➡️ Your detection value lives in phases 1 and 2. That's where review data earns its place in the stack, as an early warning system that gives CS the lead time to have a real conversation while one is still possible.
Does review sentiment actually predict churn?
How accurate is sentiment analysis for churn prediction?
- Models combining behavioural data with sentiment analysis from reviews and feedback achieve 85–92% accuracy in identifying at-risk customers, compared to 70–78% for behavioural data alone. The improvement comes specifically from timing: review sentiment captures the emotional pre-decision phase that usage data doesn't reach.
- 70–80% of churned customers showed identifiable risk signals 30 or more days before cancellation. Those signals existed. They simply weren't being read, because most churn stacks don't have visibility into the external channels where customers write honestly about their experience.
The key caveat: no single source is sufficient. Social intelligence plays its most useful role when it connects public signals to broader customer experience systems, not when it's treated as a standalone reputation monitoring tool. Review data works as a churn intelligence layer when it's part of a stack, not when it's sitting in a silo.
→ Related: Sentiment Alone Is Not a Strategy: How to Use Social Data in Strategic Decision-Making – why a sentiment score without context doesn't protect revenue.
Why one review source isn't enough
Why does churn signal detection require multi-source review data?
The highest-confidence churn signal isn't a single negative review on one platform. It's the same friction theme appearing across multiple channels simultaneously: support tickets, app store reviews, and industry review sites all surfacing the same complaint.
Here's what this looks like in practice. A customer:
- Leaves a 3-star review on a B2B review site mentioning slow support response times
- Posts on a community forum asking whether anyone has found a better alternative
- Leaves an app store review a week later: "it does the job but feels limited"
- Goes silent across all public review channels for three weeks
None of those data points trip an alarm on their own. Together, they trace a clear pre-churn trajectory. But the pattern only becomes visible if you're reading across all four sources simultaneously.
The most predictive churn signals tend to be complaints surfacing across multiple channels at the same time. Single-channel signals are noisy; multi-channel convergence on the same theme is the high-confidence indicator.
So a monitoring setup covering one review platform produces a partial picture, which means the converging patterns that are actually predictive never come into focus. ⚠️
→ Related: How to Map The Full Customer Voice by Combining Social and Review Data – a practical guide to building multi-source coverage.
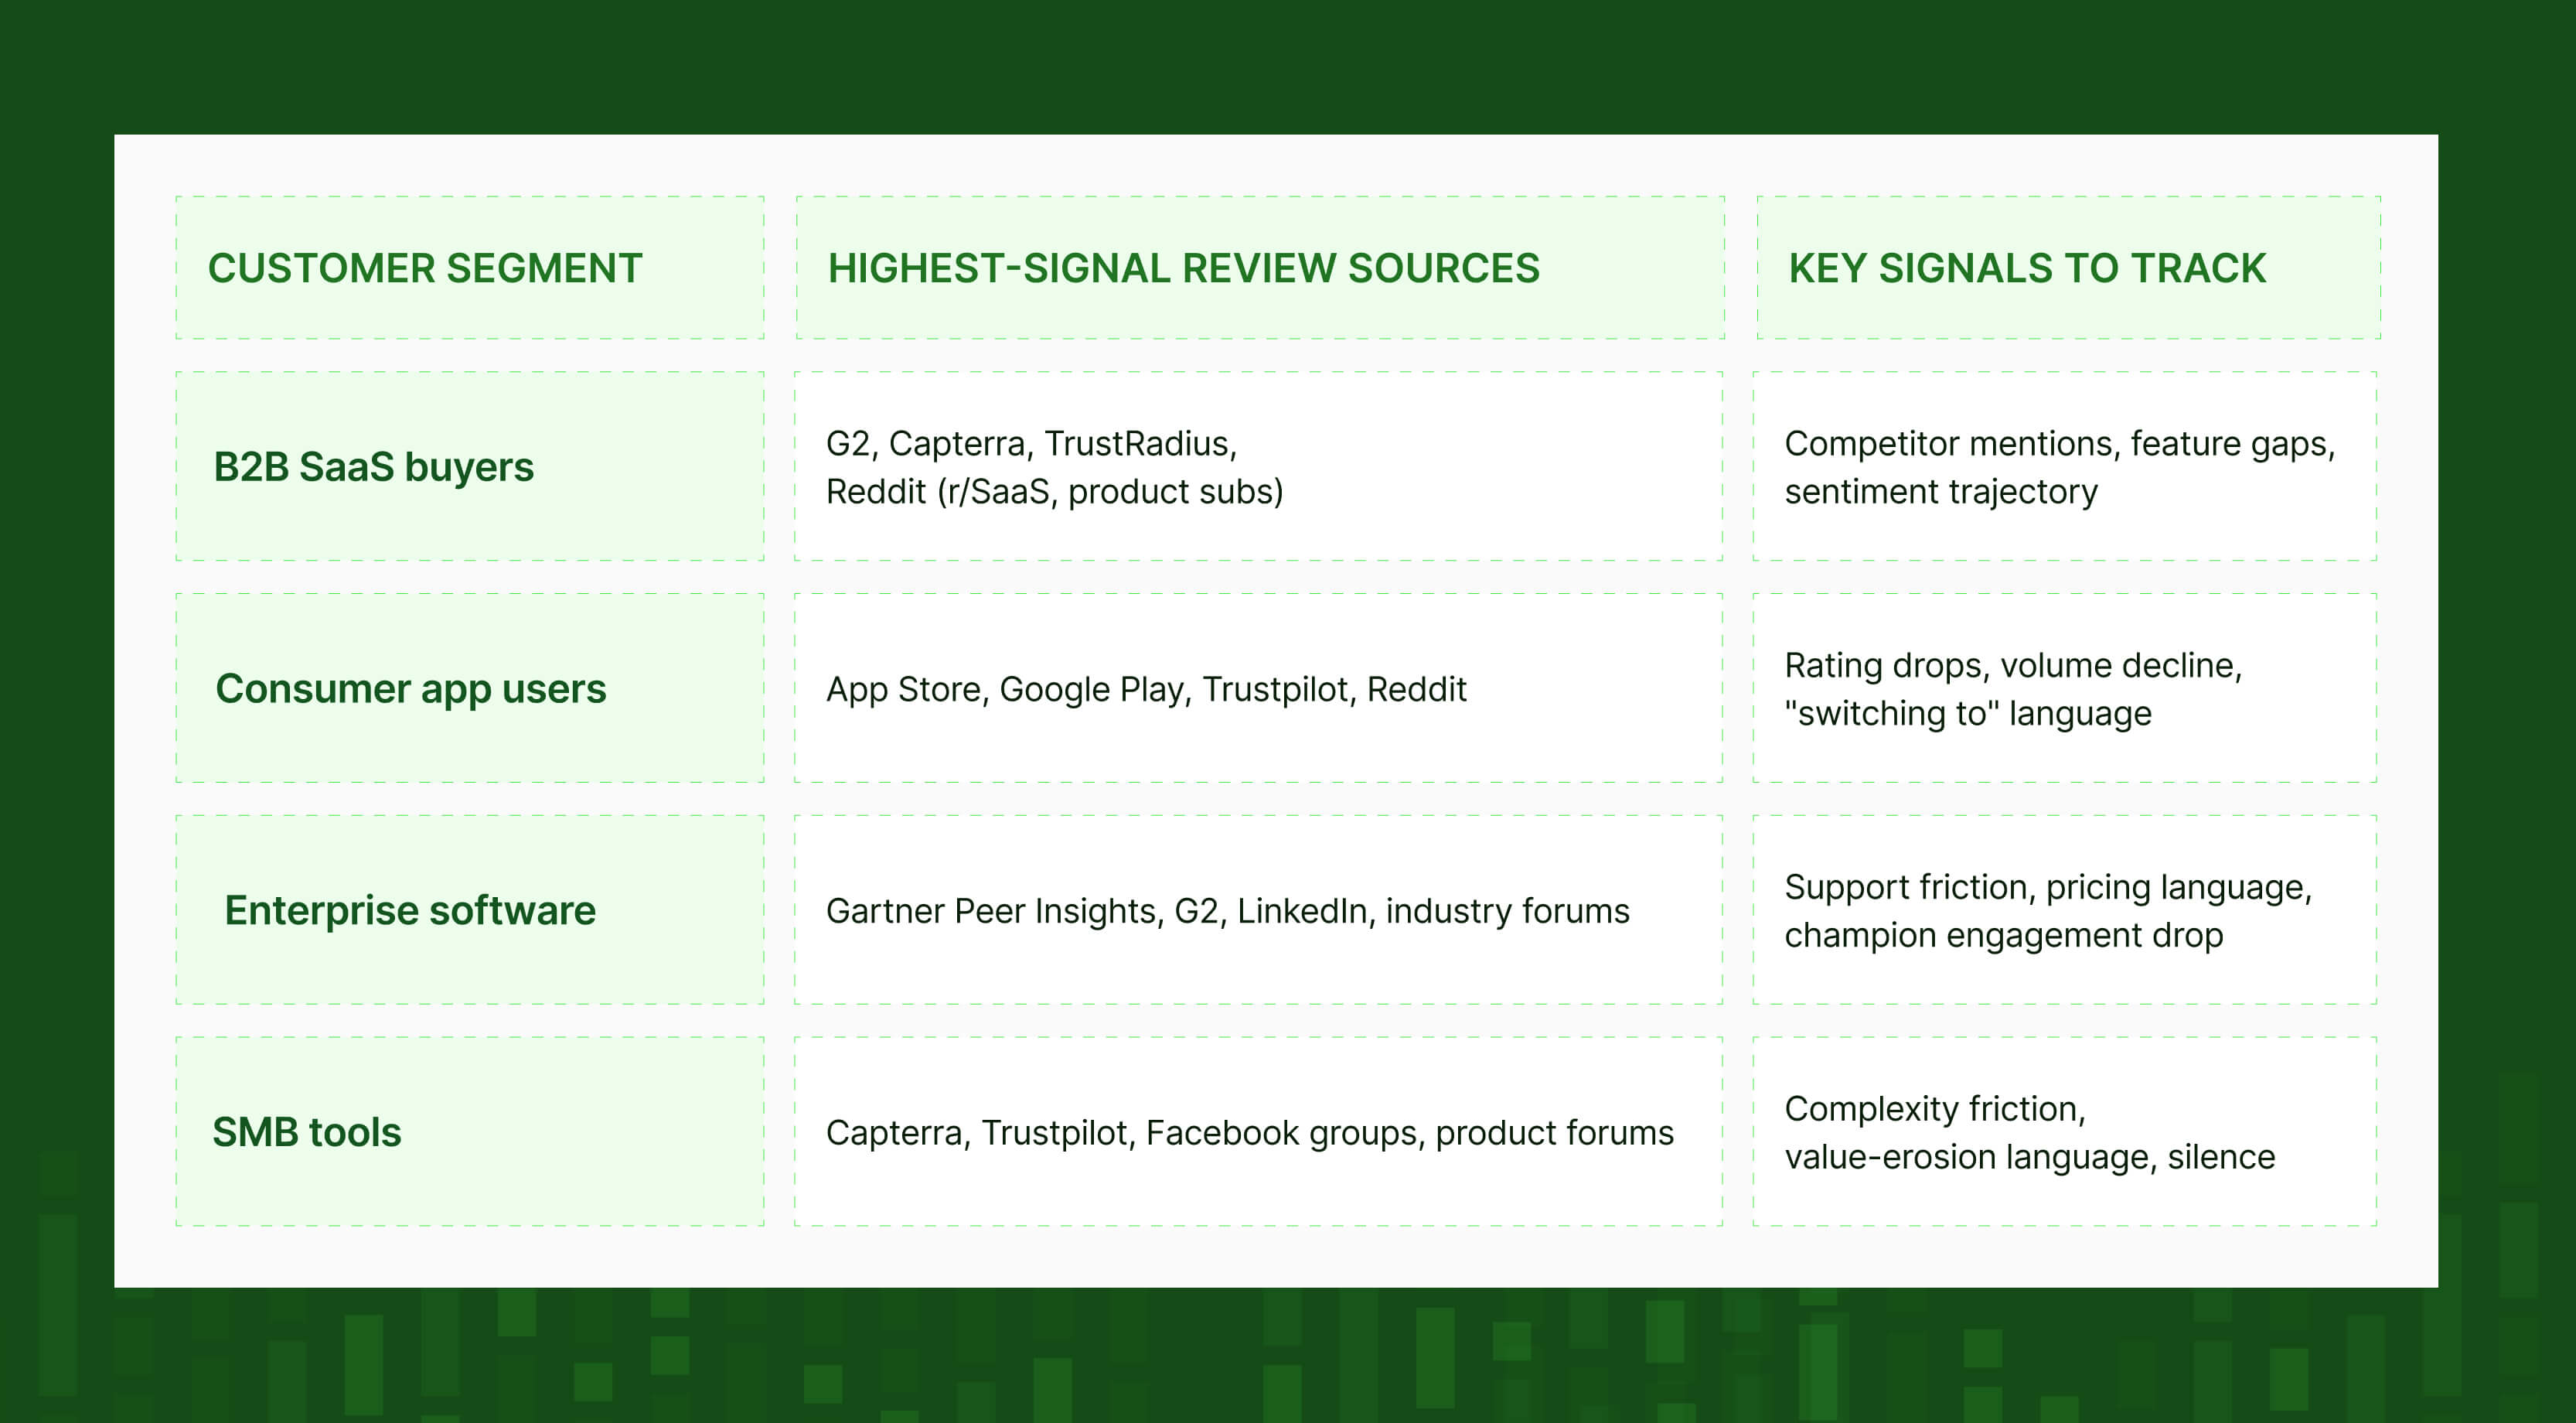
Which sources to look for customer churn, by customer type
→ Related: App Store Review Data API Access: What You Can (and Can't) Get in 2026 – what's actually accessible from the App Store and Google Play, and where the gaps are.
How to act on review churn signals: a practical framework
Spotting churn signals in customer reviews is only useful if you have a system to catch them early, route them to the right people, and act while the intervention window is open.
Here are four steps to building that system ⬇️
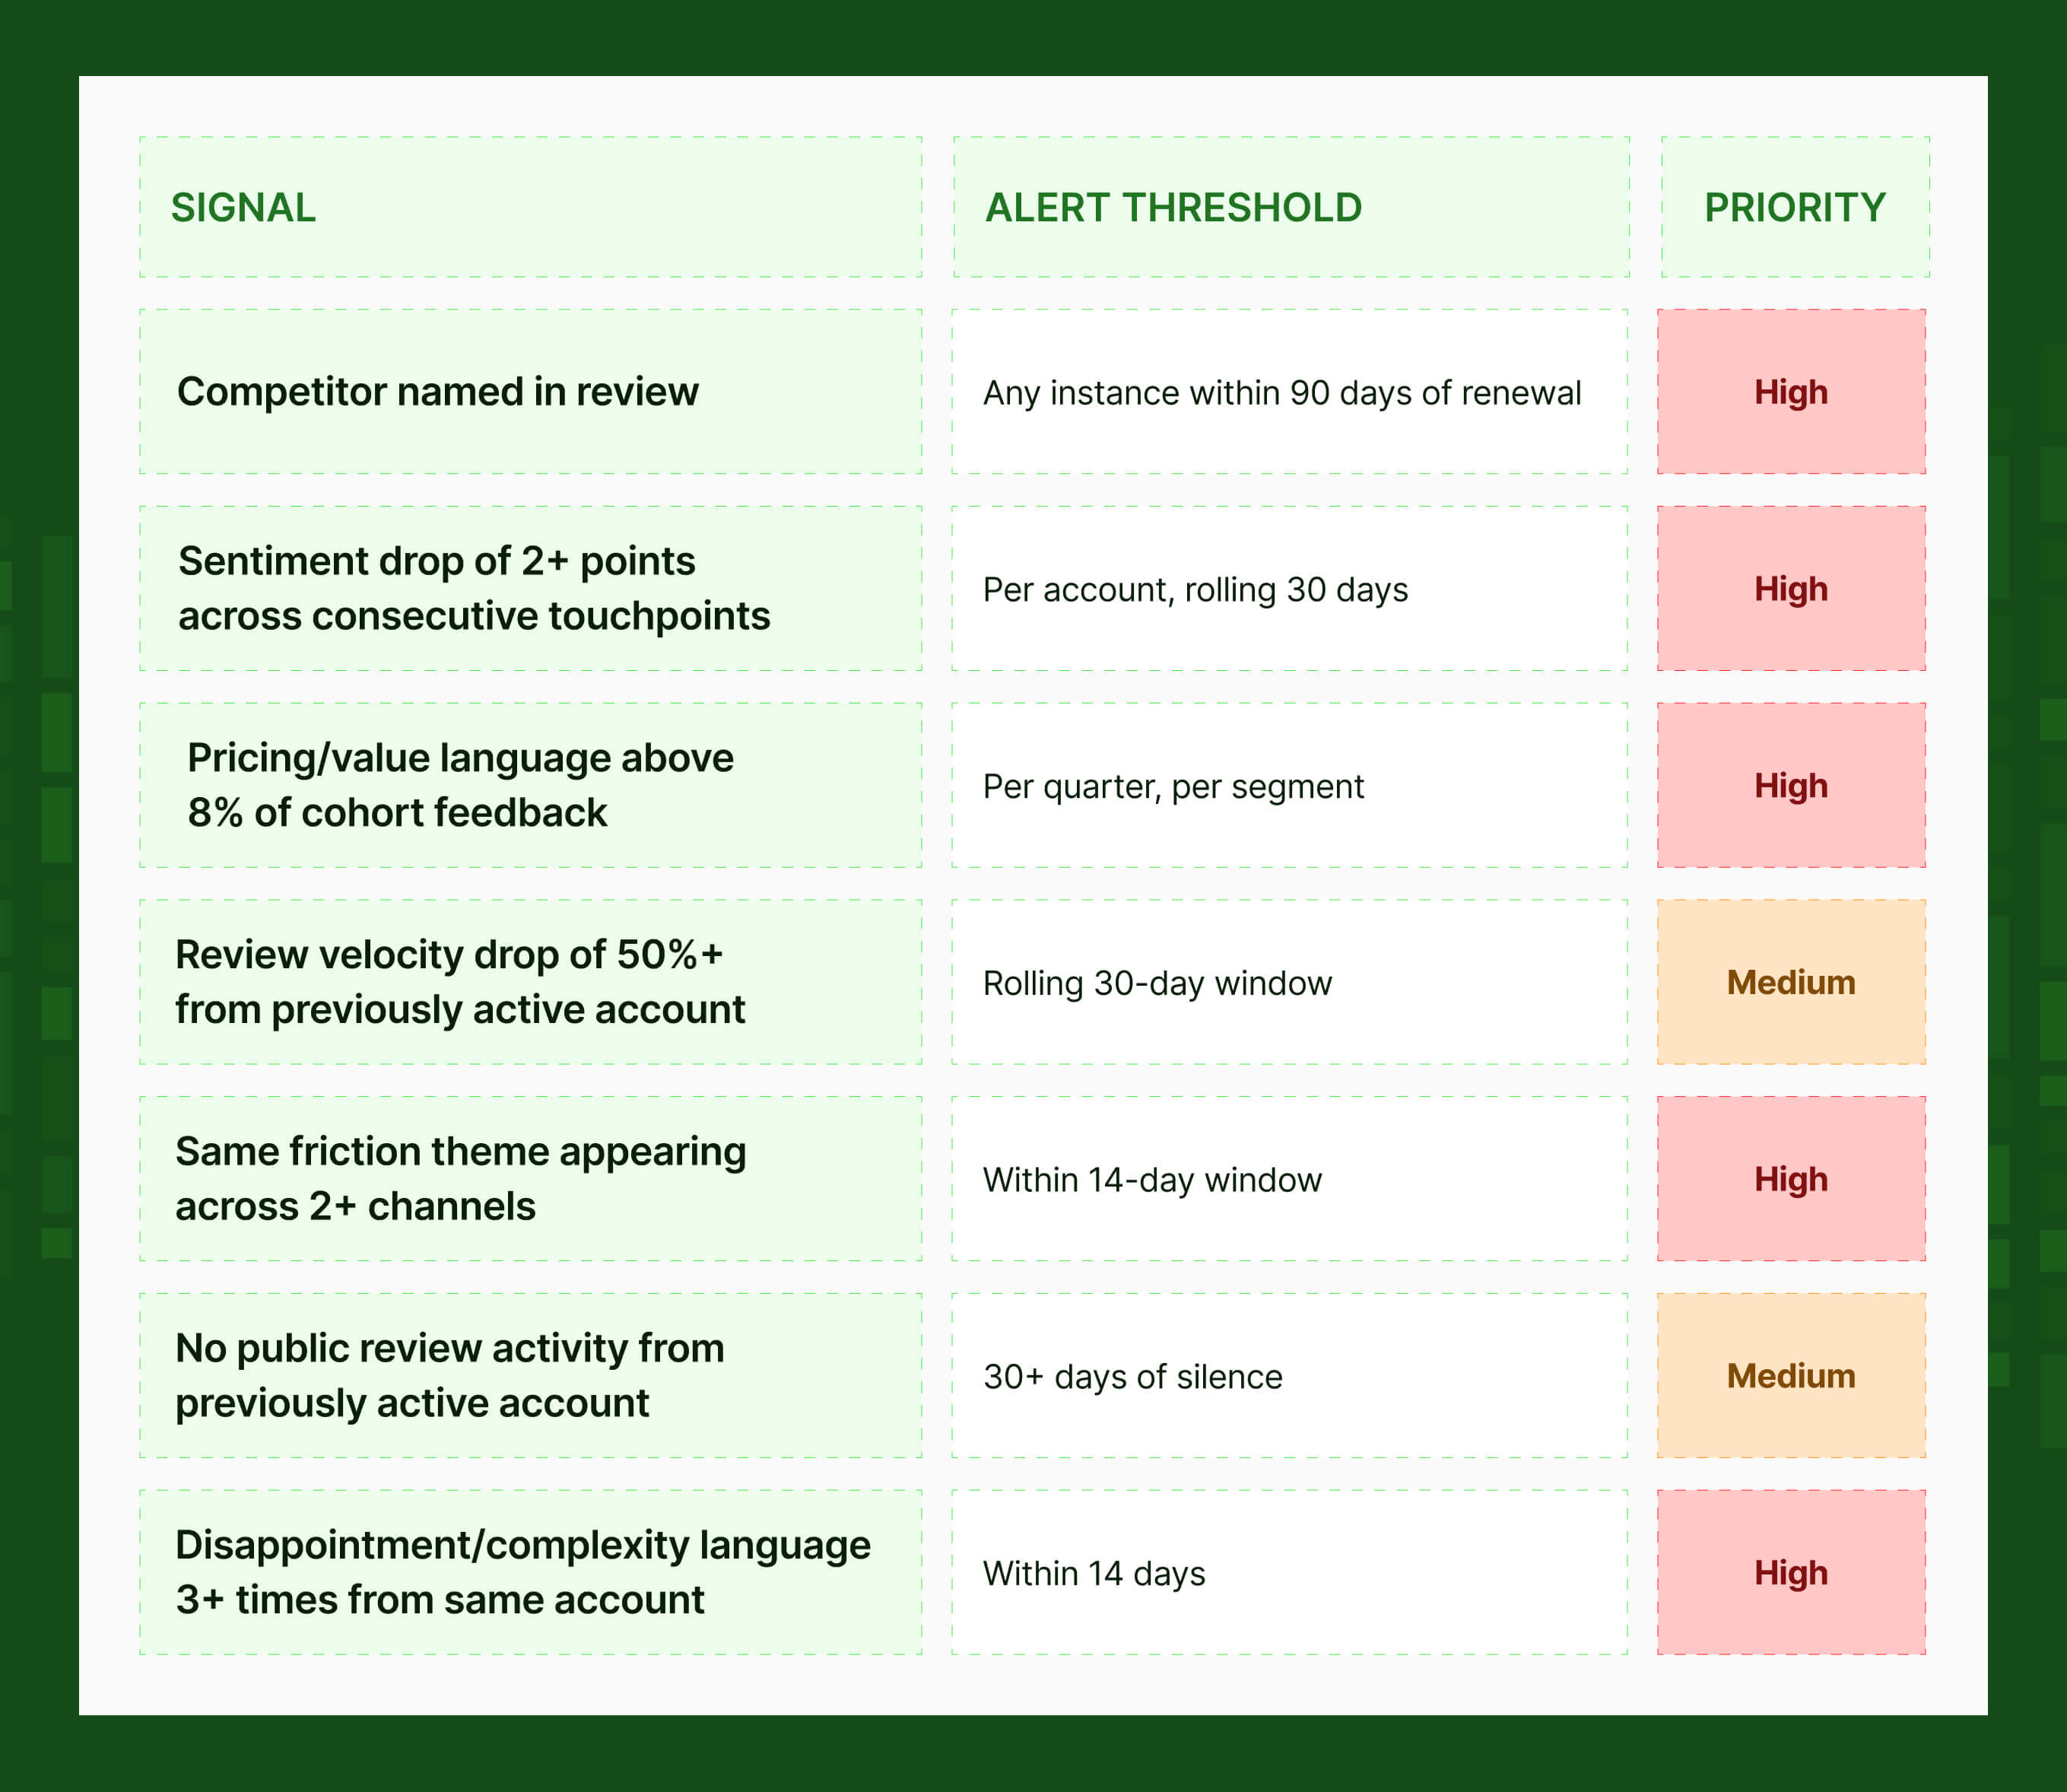
Step 1: Set thresholds, not individual alerts
Don't monitor for individual reviews, monitor for patterns crossing a defined threshold.
Step 2: Connect signals to account revenue context
A complaint theme showing up in 5% of reviews looks different if those reviewers represent 40% of your ARR. Before routing signals to CS, enrich them with account context: ARR, renewal date, tier, CSM assignment, and time since last positive interaction.
The goal isn't to flag every signal, it's to surface the signals that matter, ordered by the revenue at risk.
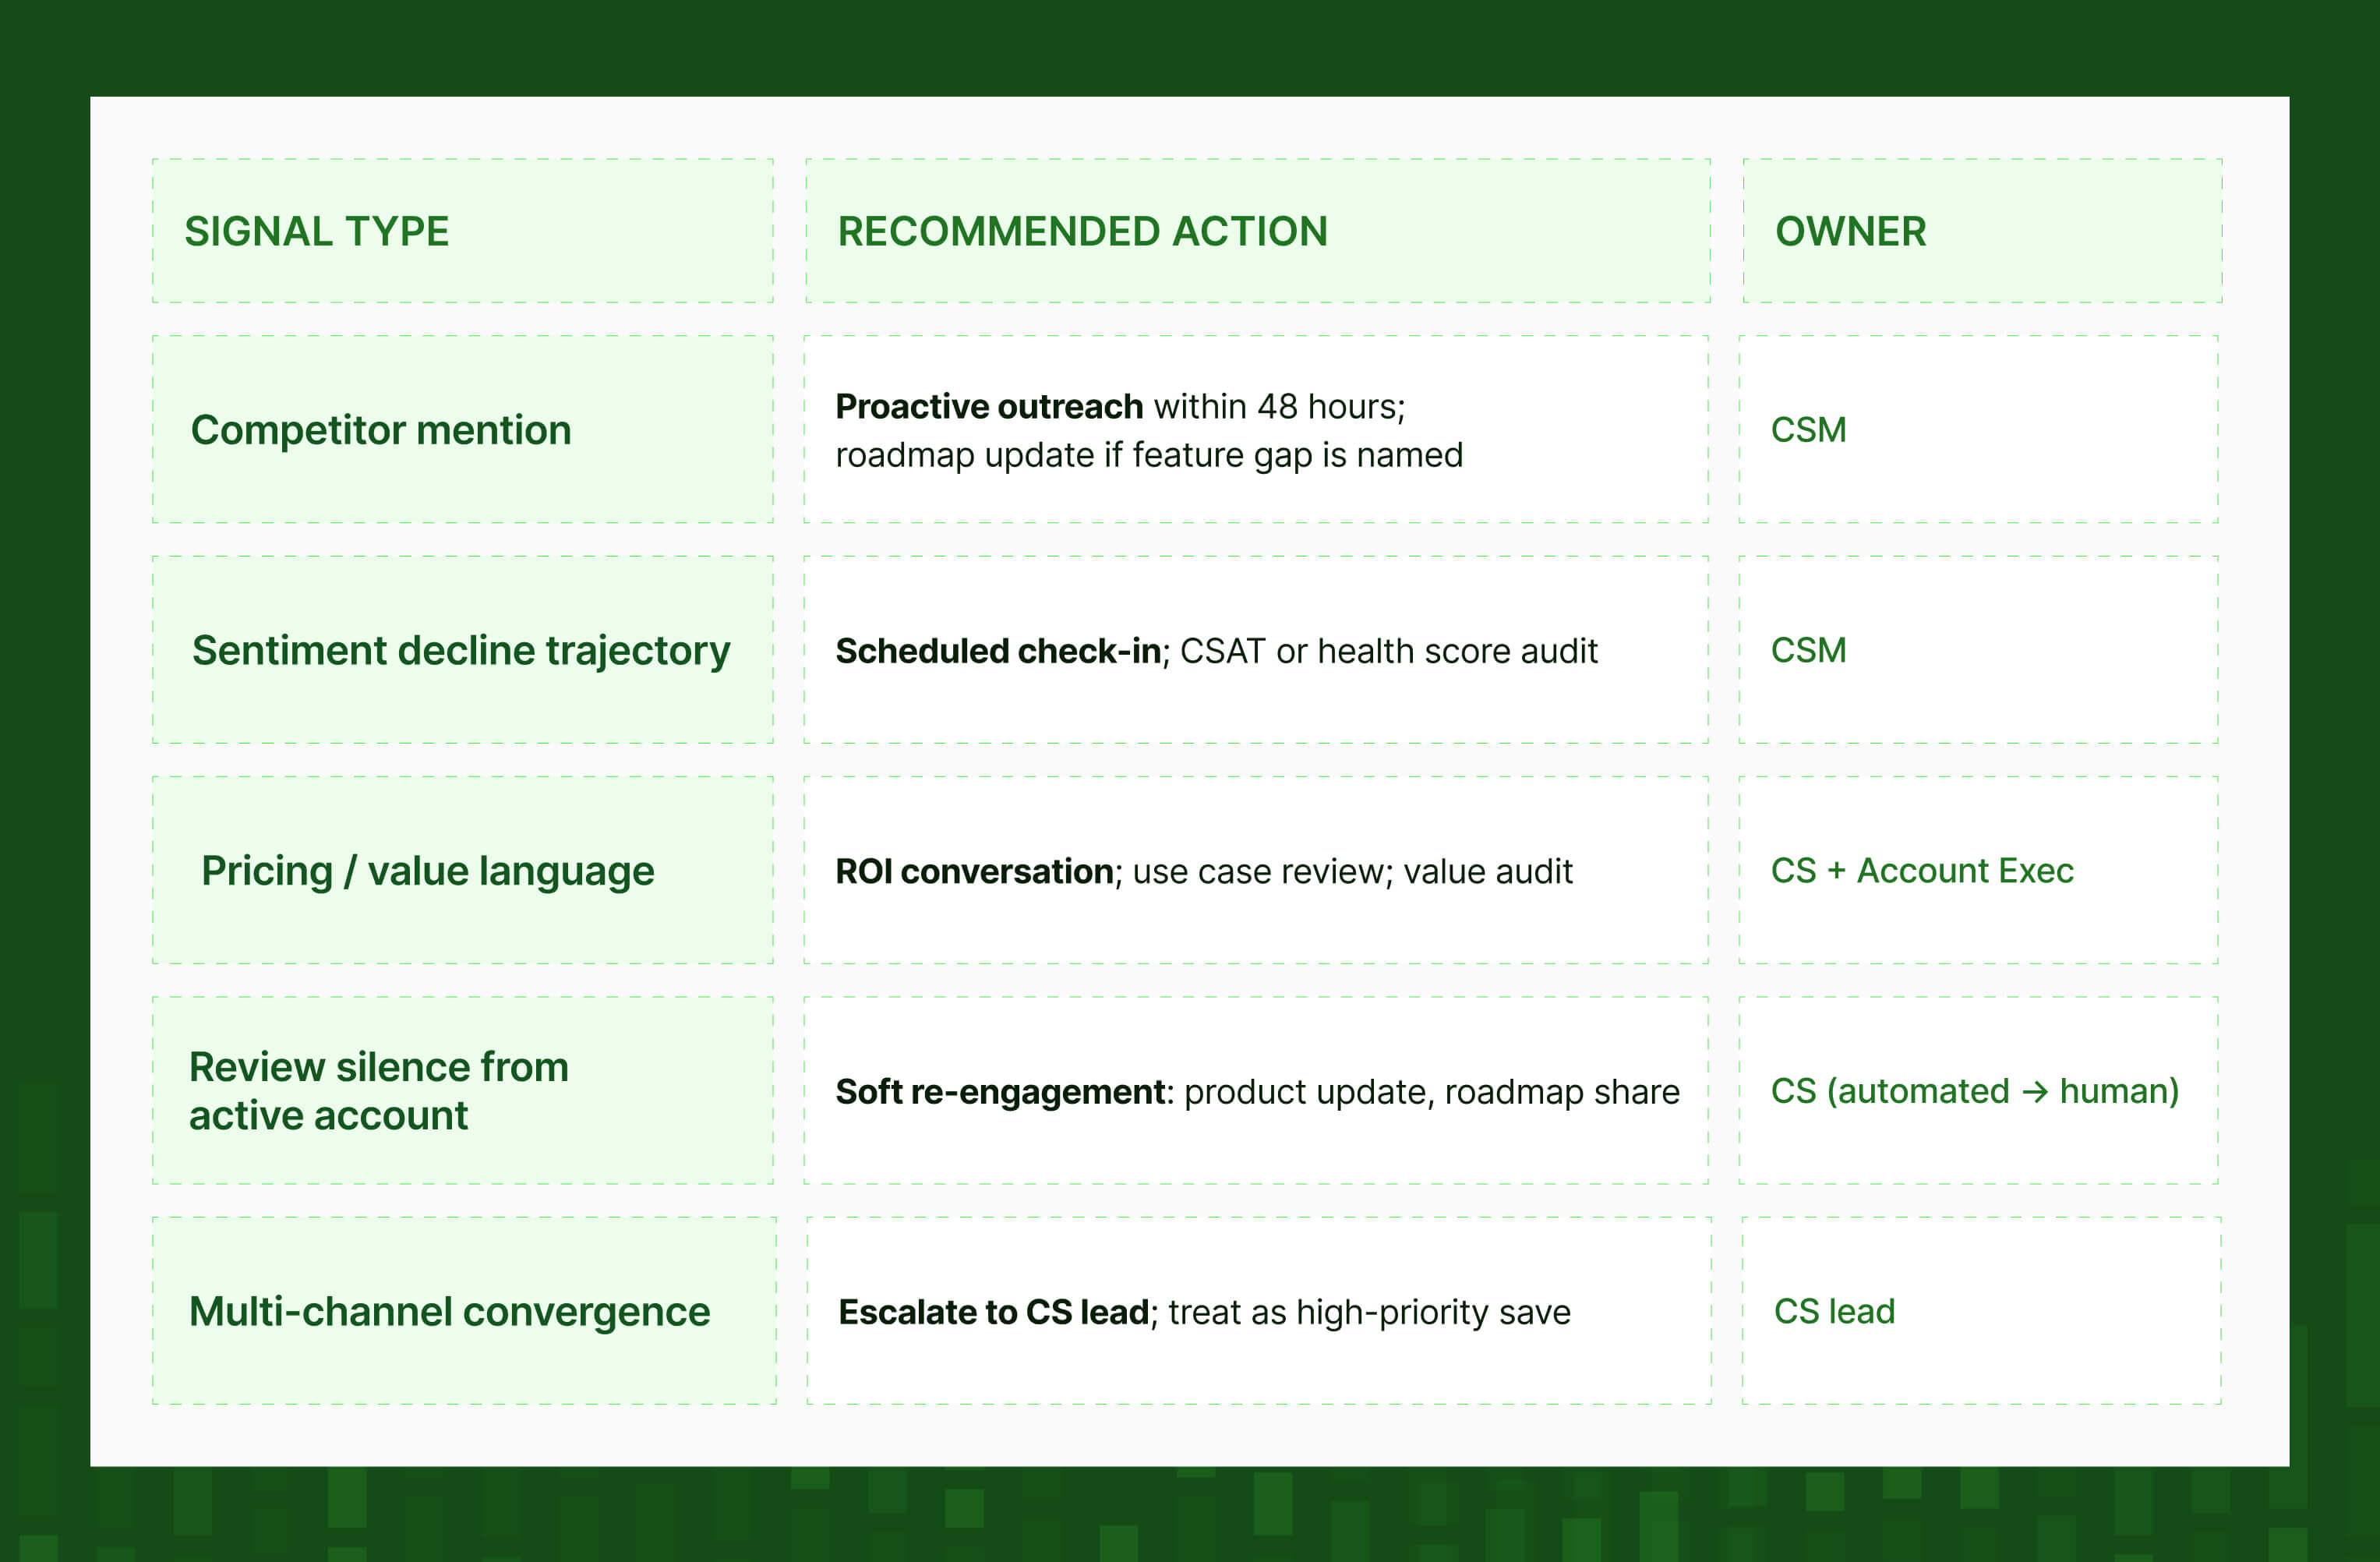
Step 3: Match intervention to signal type
Not every signal warrants a CS call. Match the response to the urgency and the specific signal type:
Step 4: Automate detection, not decisions
AI excels at finding the signal; humans are still better at deciding what to do about it. The output of a functioning review signal system should be a prioritised list of accounts for your CS team to investigate, not a set of automated interventions firing without context.
➡️ Intervention at 90 days succeeds 40–60% of the time. At 30 days, it drops to 10–20%. Speed matters, but speed plus context is what saves accounts. Automation handles detection and rt outing. Humanus handle the conversation.
→ Related: The Most Impactful Use Cases for Social Data in 2026 – how teams are operationalising public data as a business intelligence layer.
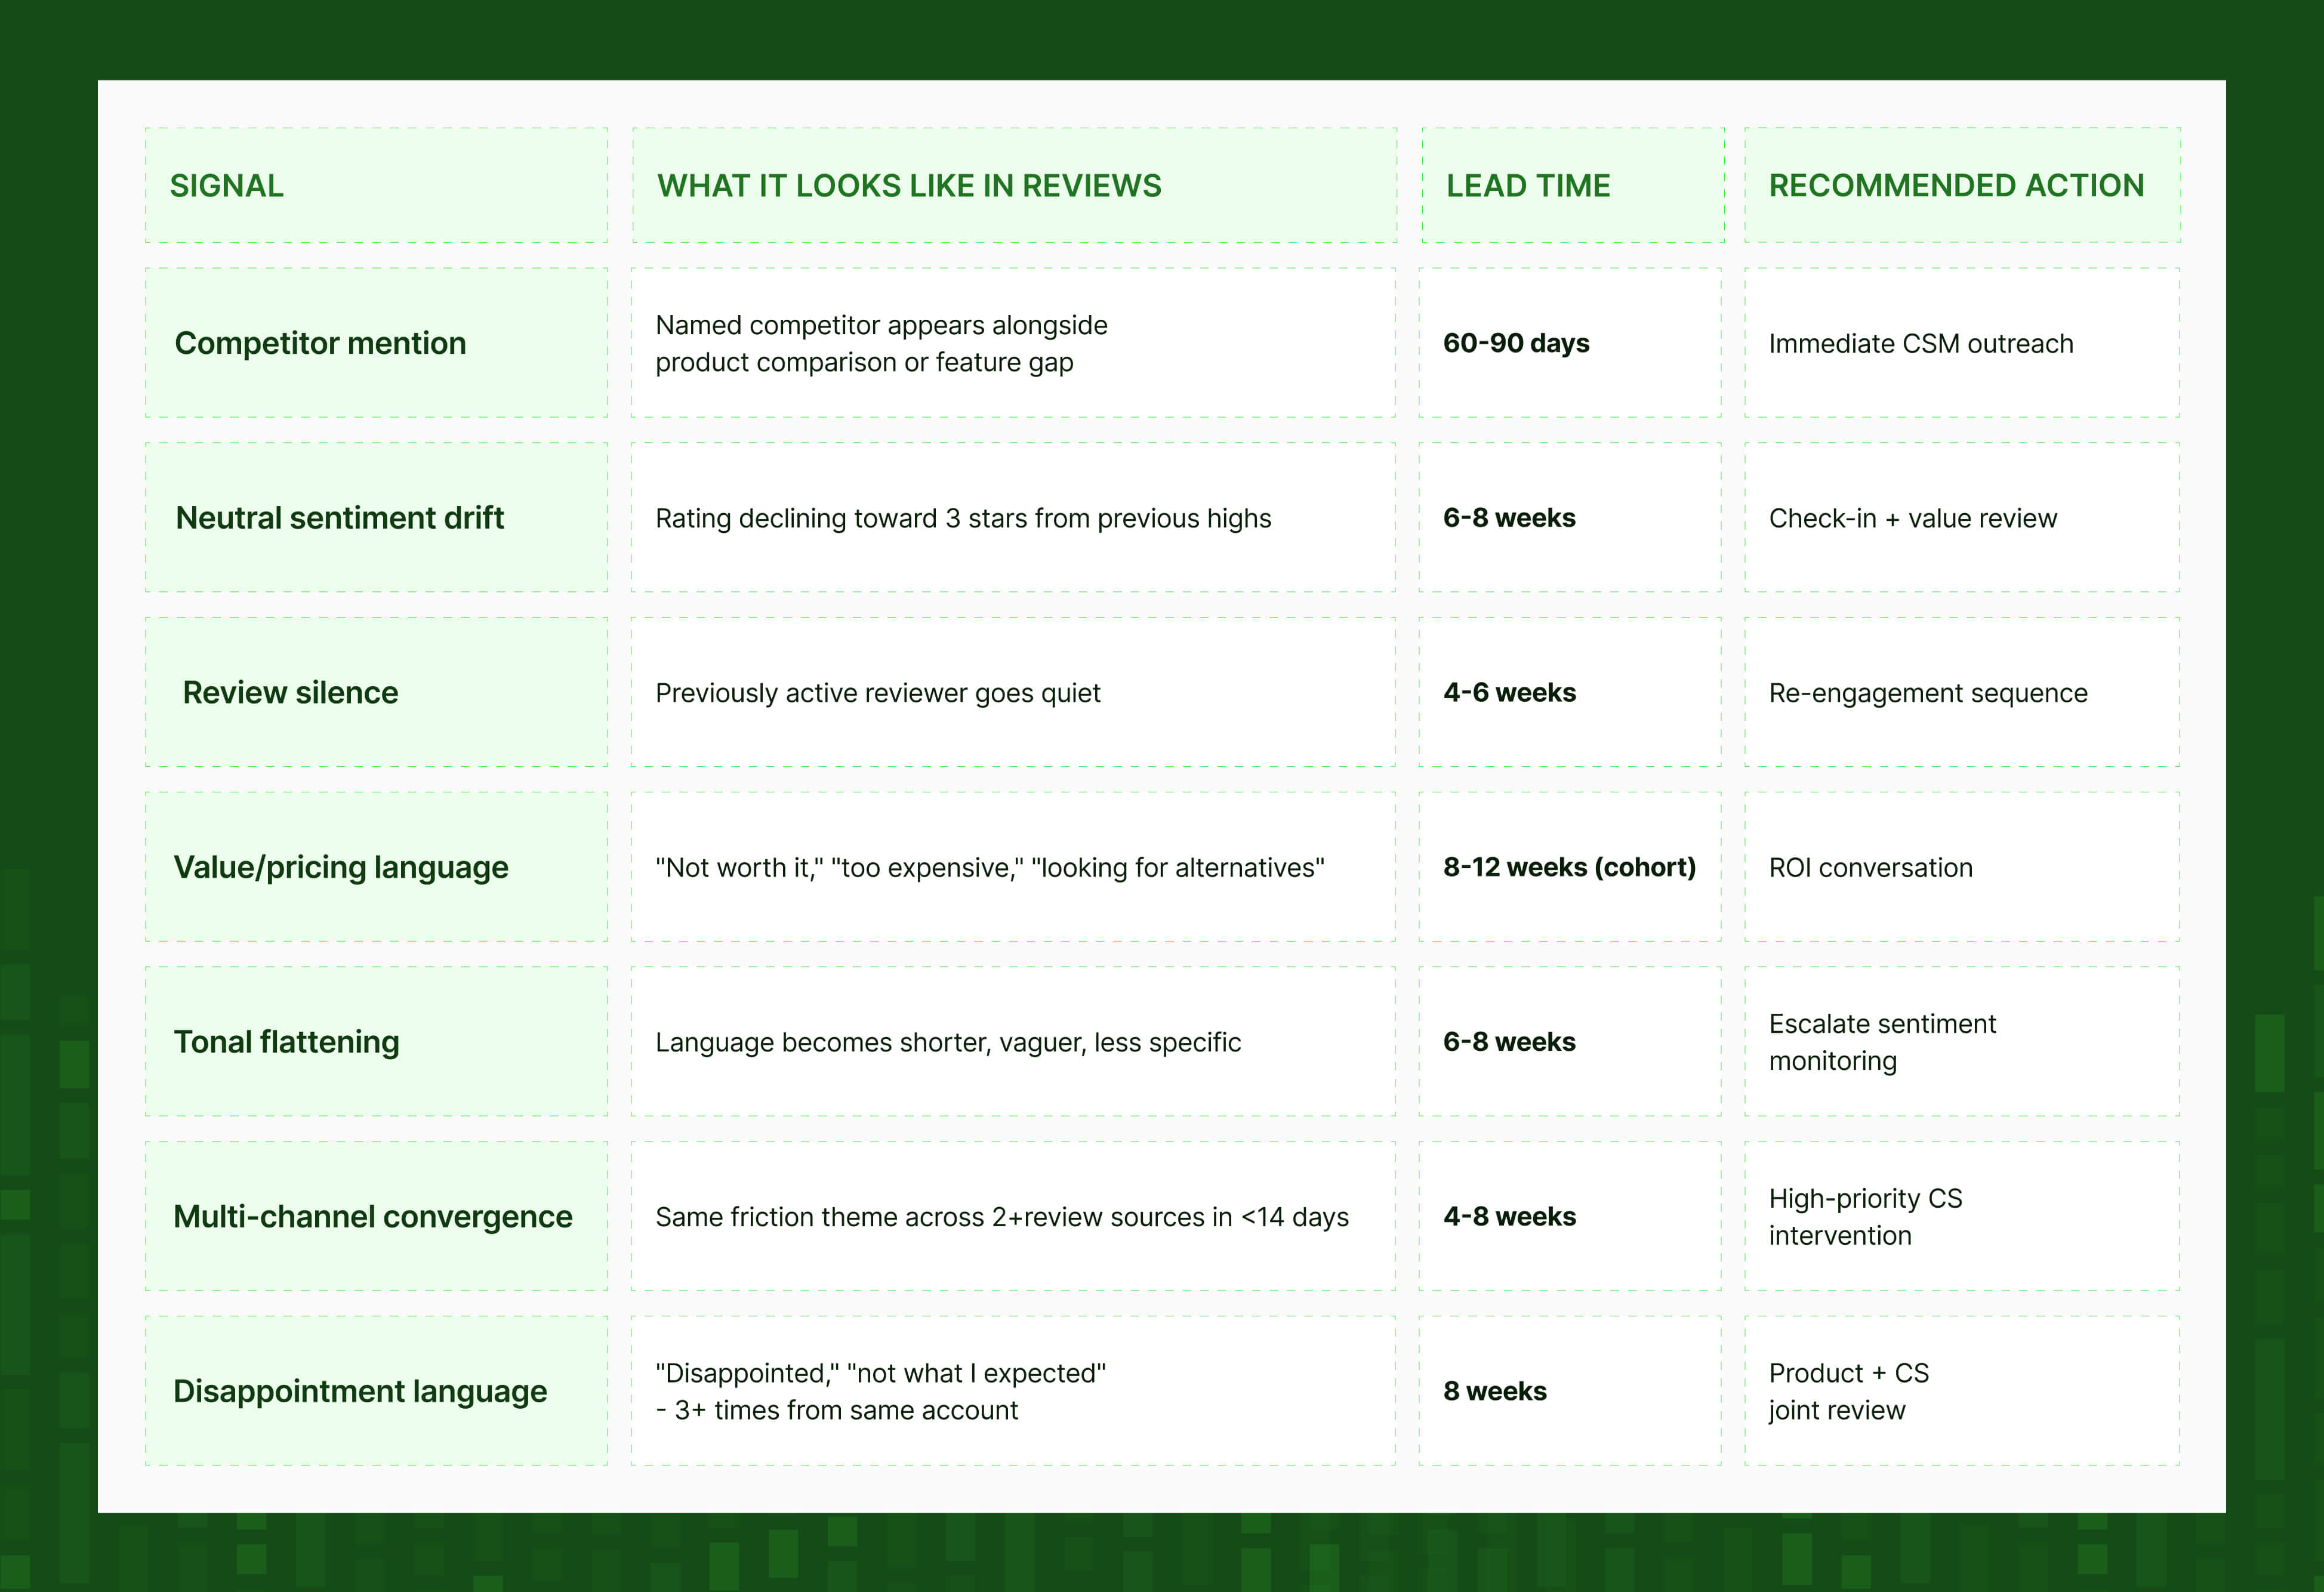
Quick reference: churn signals in customer reviews
The bottom line
Churn signals in customer reviews are real, detectable, and appear weeks before your internal product data shows anything unusual.
And the customers most likely to leave often aren't the ones filing complaints, they're the ones going quiet, drifting toward neutral, or name-dropping competitors in their public feedback.
The five patterns worth monitoring are:
- Competitor mentions (60–90 days)
- Pricing and value language (8–12 weeks at cohort level)
- Tonal flattening (6–8 weeks)
- Neutral sentiment drift (6–8 weeks)
- And review silence (4–6 weeks).
What makes this tractable in practice is coverage. A monitoring setup built on one platform misses the converging signals. Review data that isn't normalised across sources produces a partial picture.
➡️ Read reviews across more sources, connect what you find to account revenue context, and act while the intervention window is still open. 👏
💡 Datashake provides social and review data infrastructure – structured, normalised data from 150+ source types, delivered via a single API. If you're building churn intelligence into your product or CS stack, we can help you get the data layer. Book a demo to see how it works.
Frequently asked questions
What is the most common churn signal in customer reviews?
The most common early churn signal in reviews is competitor mentions; customers who name a specific competitor in their feedback churn at 4x the baseline rate within 60 days. However, review silence (previously active reviewers going quiet) is often the most predictive signal of imminent churn, appearing just 4–6 weeks before cancellation.
How early do churn signals appear in reviews before a customer cancels?
Feedback-based churn signals typically appear 4-8 weeks before customer success health scores reflect the same pattern. Competitor mentions and pricing language can appear up to 90 days before cancellation. Silence and tonal flattening tend to appear 4–6 weeks out.
Are 3-star reviews a churn warning sign?
Yes, and often a more serious one than 1-star reviews. Customers who post 1-star reviews are still engaged with the brand. Customers drifting toward 3 stars – describing your product as "fine" or "adequate" – have typically begun disengaging. When a previously positive reviewer drifts toward neutral across consecutive touchpoints, that trajectory is a reliable early churn signal.
Why do customers who stop complaining churn more than those who complain?
Only 1 in 26 unhappy customers actually complains, the other 25 leave silently. When a customer stops raising issues, it usually means they've concluded that nothing will change, and they're quietly evaluating alternatives. Customers who stop complaining are 3.2x more likely to churn within 30 days than those still actively frustrated.
How accurate is sentiment analysis for predicting customer churn?
Churn prediction models that combine behavioural data with sentiment analysis from reviews and feedback achieve 85–92% accuracy, compared to 70–78% for behavioural data alone. The accuracy improvement comes from timing; review sentiment captures emotional decision-making 4–8 weeks before it shows up in product usage metrics.
Do you need data from multiple review platforms to detect churn signals?
Yes. Single-channel signals are noisy, the high-confidence churn indicator is the same friction theme appearing across multiple channels simultaneously. A customer complaining about billing in an app store review, raising competitor comparisons on Reddit, and going neutral on a B2B review site shows a churn pattern that only becomes visible when you're reading all three sources together.
.png)



More insights you might like