6 Fixes to Improve Your Social Media Data Pipeline

You're mid-sprint. An engineer pings you: the engagement numbers for last week look off.
You pull the ingestion logs. A cron job re-ran after a timeout, and nobody had deduplication logic in place to catch it.
That's a very standard failure mode when it comes to social media data pipelines.
For teams building social intelligence products, ORM platforms, or customer experience tools on top of social data, the problem seeps into product reliability. The gaps in your pipeline become the gaps in what your customers can trust.
This post covers six fixes for the most common failure modes, with specific implementation patterns for each. ⬇️
What are the most impactful ways to improve a social media data pipeline?
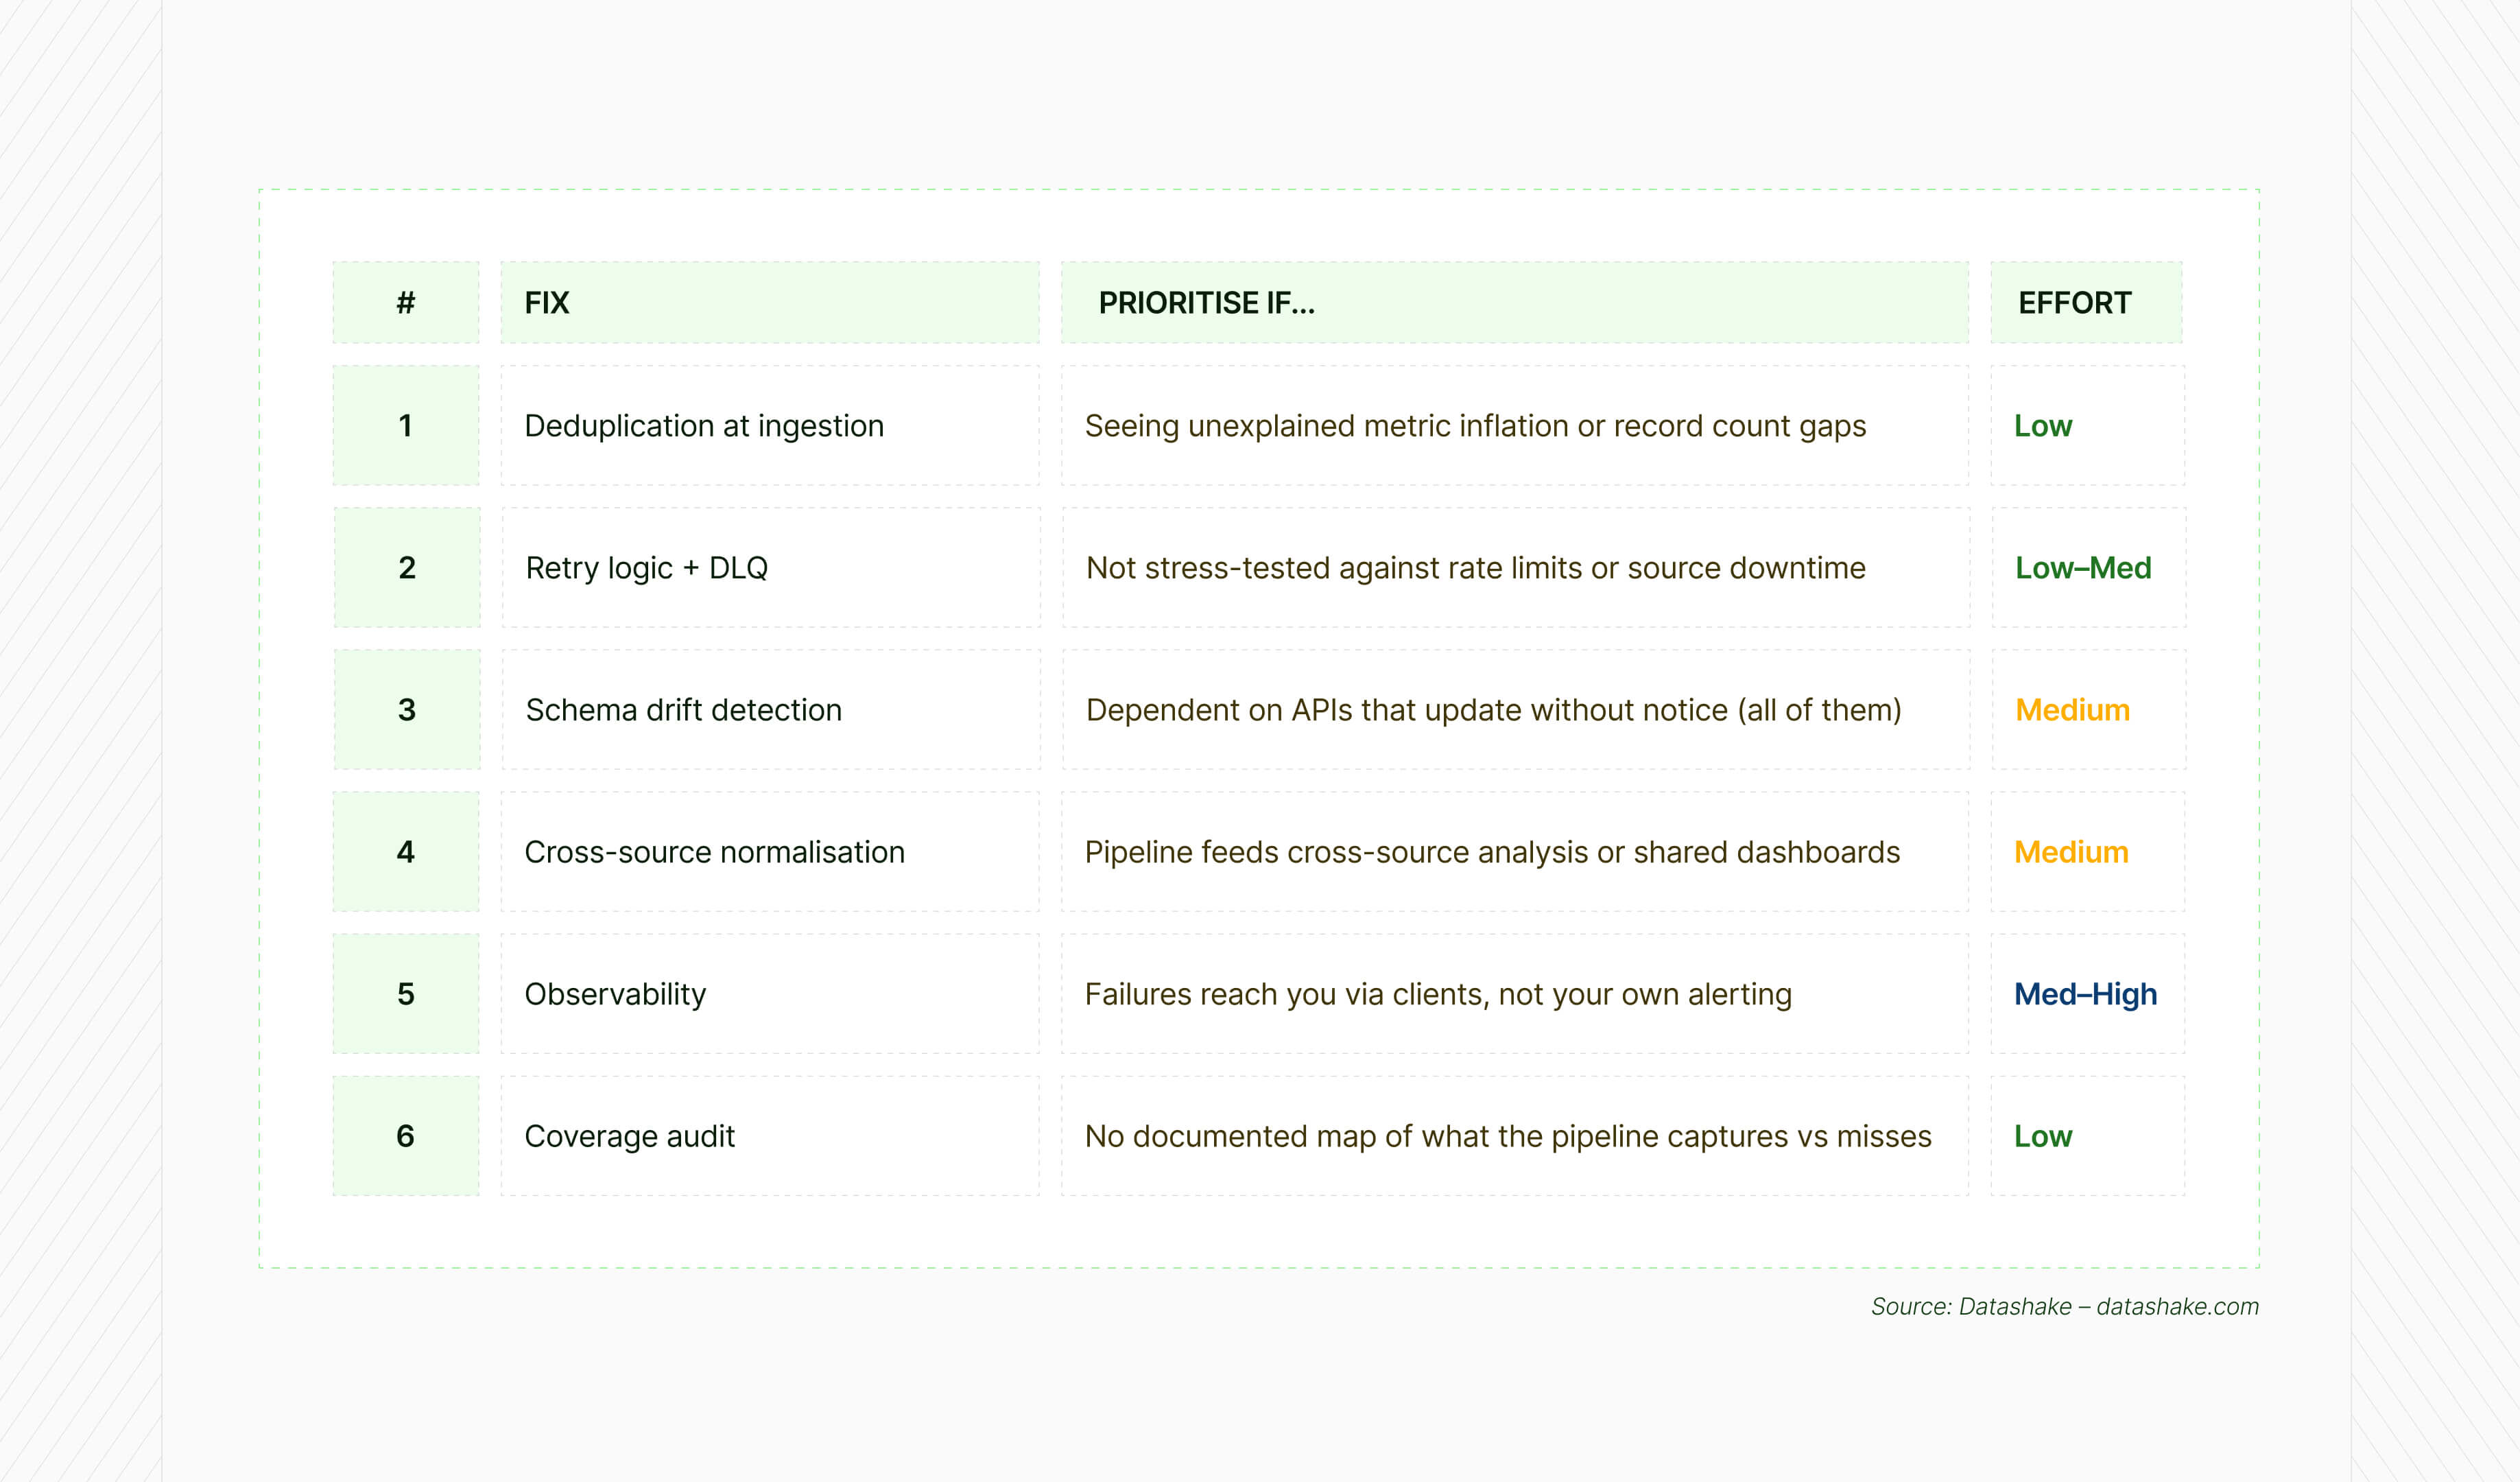
Fix your deduplication logic at ingestion, not downstream. Implement exponential backoff with a dead letter queue for failed requests. Build schema drift detection before a silent field rename corrupts weeks of data. Switch to watermark-based incremental loading to eliminate redundant re-ingestion. Normalise cross-platform metrics at the transformation layer so comparisons actually mean something. Add pipeline observability so you hear about failures from your own monitoring.
Why social data pipelines are a different kind of maintenance problem
Social data pipelines are harder to keep reliable than most integrations. Here’s why:
1. Every source has its own schema, and changes it on their schedule
Each source defines its own metrics differently.
Engagement on one includes saves and link clicks. On another, it's only likes and comments. A field called impressions in one response schema measures something meaningfully different in another.
You're constantly reconciling competing definitions across multiple sources, while each source reserves the right to change theirs without telling you.
2. API changes don't come with warnings
Endpoints get deprecated. Field names shift. Data types change from string to integer.
When that happens, you don't always get an error. You get bad data flowing downstream, and the first sign is usually someone questioning the numbers, not an alert firing.
By the time it surfaces, the bad data is already in your tables.
3. Volume exposes problems that staging never catches
A pipeline that runs cleanly at 100 records breaks at 100,000. Timeouts that were theoretical become real. Retry gaps that were negligible start stacking up.
The sequential processing approach that looked fine in staging becomes the production bottleneck, and the only way to find that out is to hit it in production.
4. Some data gaps aren’t fixable
Short-form video, stories, live streams – many content formats are inaccessible via standard API endpoints. Rate limits create collection windows rather than continuous streams.
You're often ingesting the best available version of the data, not the complete version.
5. New platforms keep appearing, and your users get there before your pipeline does
Social behaviour moves fast. A niche network gains traction, your users start posting there, and suddenly there's a meaningful slice of conversation your pipeline isn't capturing at all.
New platforms rarely have mature, stable APIs: rate limits are inconsistent, documentation is sparse, and schemas change frequently as the product itself is still being built.
Adding a new source is committing to maintaining something that's actively shifting under you.
So how do you fix these? Let’s explore ⬇️
⚠️ A note on data providers
In this post, we talk about how you handle data once it's flowing into your pipeline. But there's a more fundamental question that sits upstream of all of them: where is that data coming from, and is the provider actually reliable?
No amount of deduplication logic, schema drift detection, or normalisation will fix data that was incomplete, skewed, or poorly structured before it reached you. If your provider only covers a handful of major platforms, you're already missing the conversations happening everywhere else. If their rate limit handling is poor, your pipeline inherits their gaps. If they don't communicate API changes proactively, you're the last to know.
When evaluating or auditing your data providers, these questions are most important:
- Coverage breadth: How many sources do they cover, including regional platforms and emerging networks? A provider covering 15–20+ sources looks very different from one covering three or four.
- Schema stability and communication: Do they notify you ahead of API changes, or do you find out when something breaks? A good provider treats your pipeline as a dependency they're responsible to.
- Data quality: Is the output clean, normalised, and consistently structured, or does it require significant transformation work on your end before it's usable?
- Reliability and uptime: What happens when a source goes down? Do they handle it, or does the gap land in your pipeline unannounced?
💡 If you're assessing your current setup or evaluating new providers, why your social media data is incomplete can help.
Fix 1: Move deduplication to the ingestion layer
What goes wrong without it
Deduplication that lives downstream (in a transformation step or a cleanup job) creates a window where duplicates accumulate undetected.
In practice:
- A cron job re-runs after a failure and ingests the same hour of data twice
- A retry fires after a timeout but the first request had already succeeded
- Months later, someone traces an unexplained metric spike and finds a chunk of records counted twice.
Backfilling is painful. But explaining inflated dashboards to clients is worse.
How to fix it
Deduplication belongs at the point of ingestion, before a record touches your database. And the mechanism is quite straightforward.
Step 1: Use source-native unique identifiers
Every record should carry a stable, source-provided ID – a post ID, comment ID, or profile ID. This is the key you deduplicate on. Don't generate your own IDs; you'll create mismatches when the same record arrives again.
Step 2: Enforce a unique constraint at the database level
This acts as a safety net when your application logic fails.
Step 3: Choose your write strategy based on what you need:
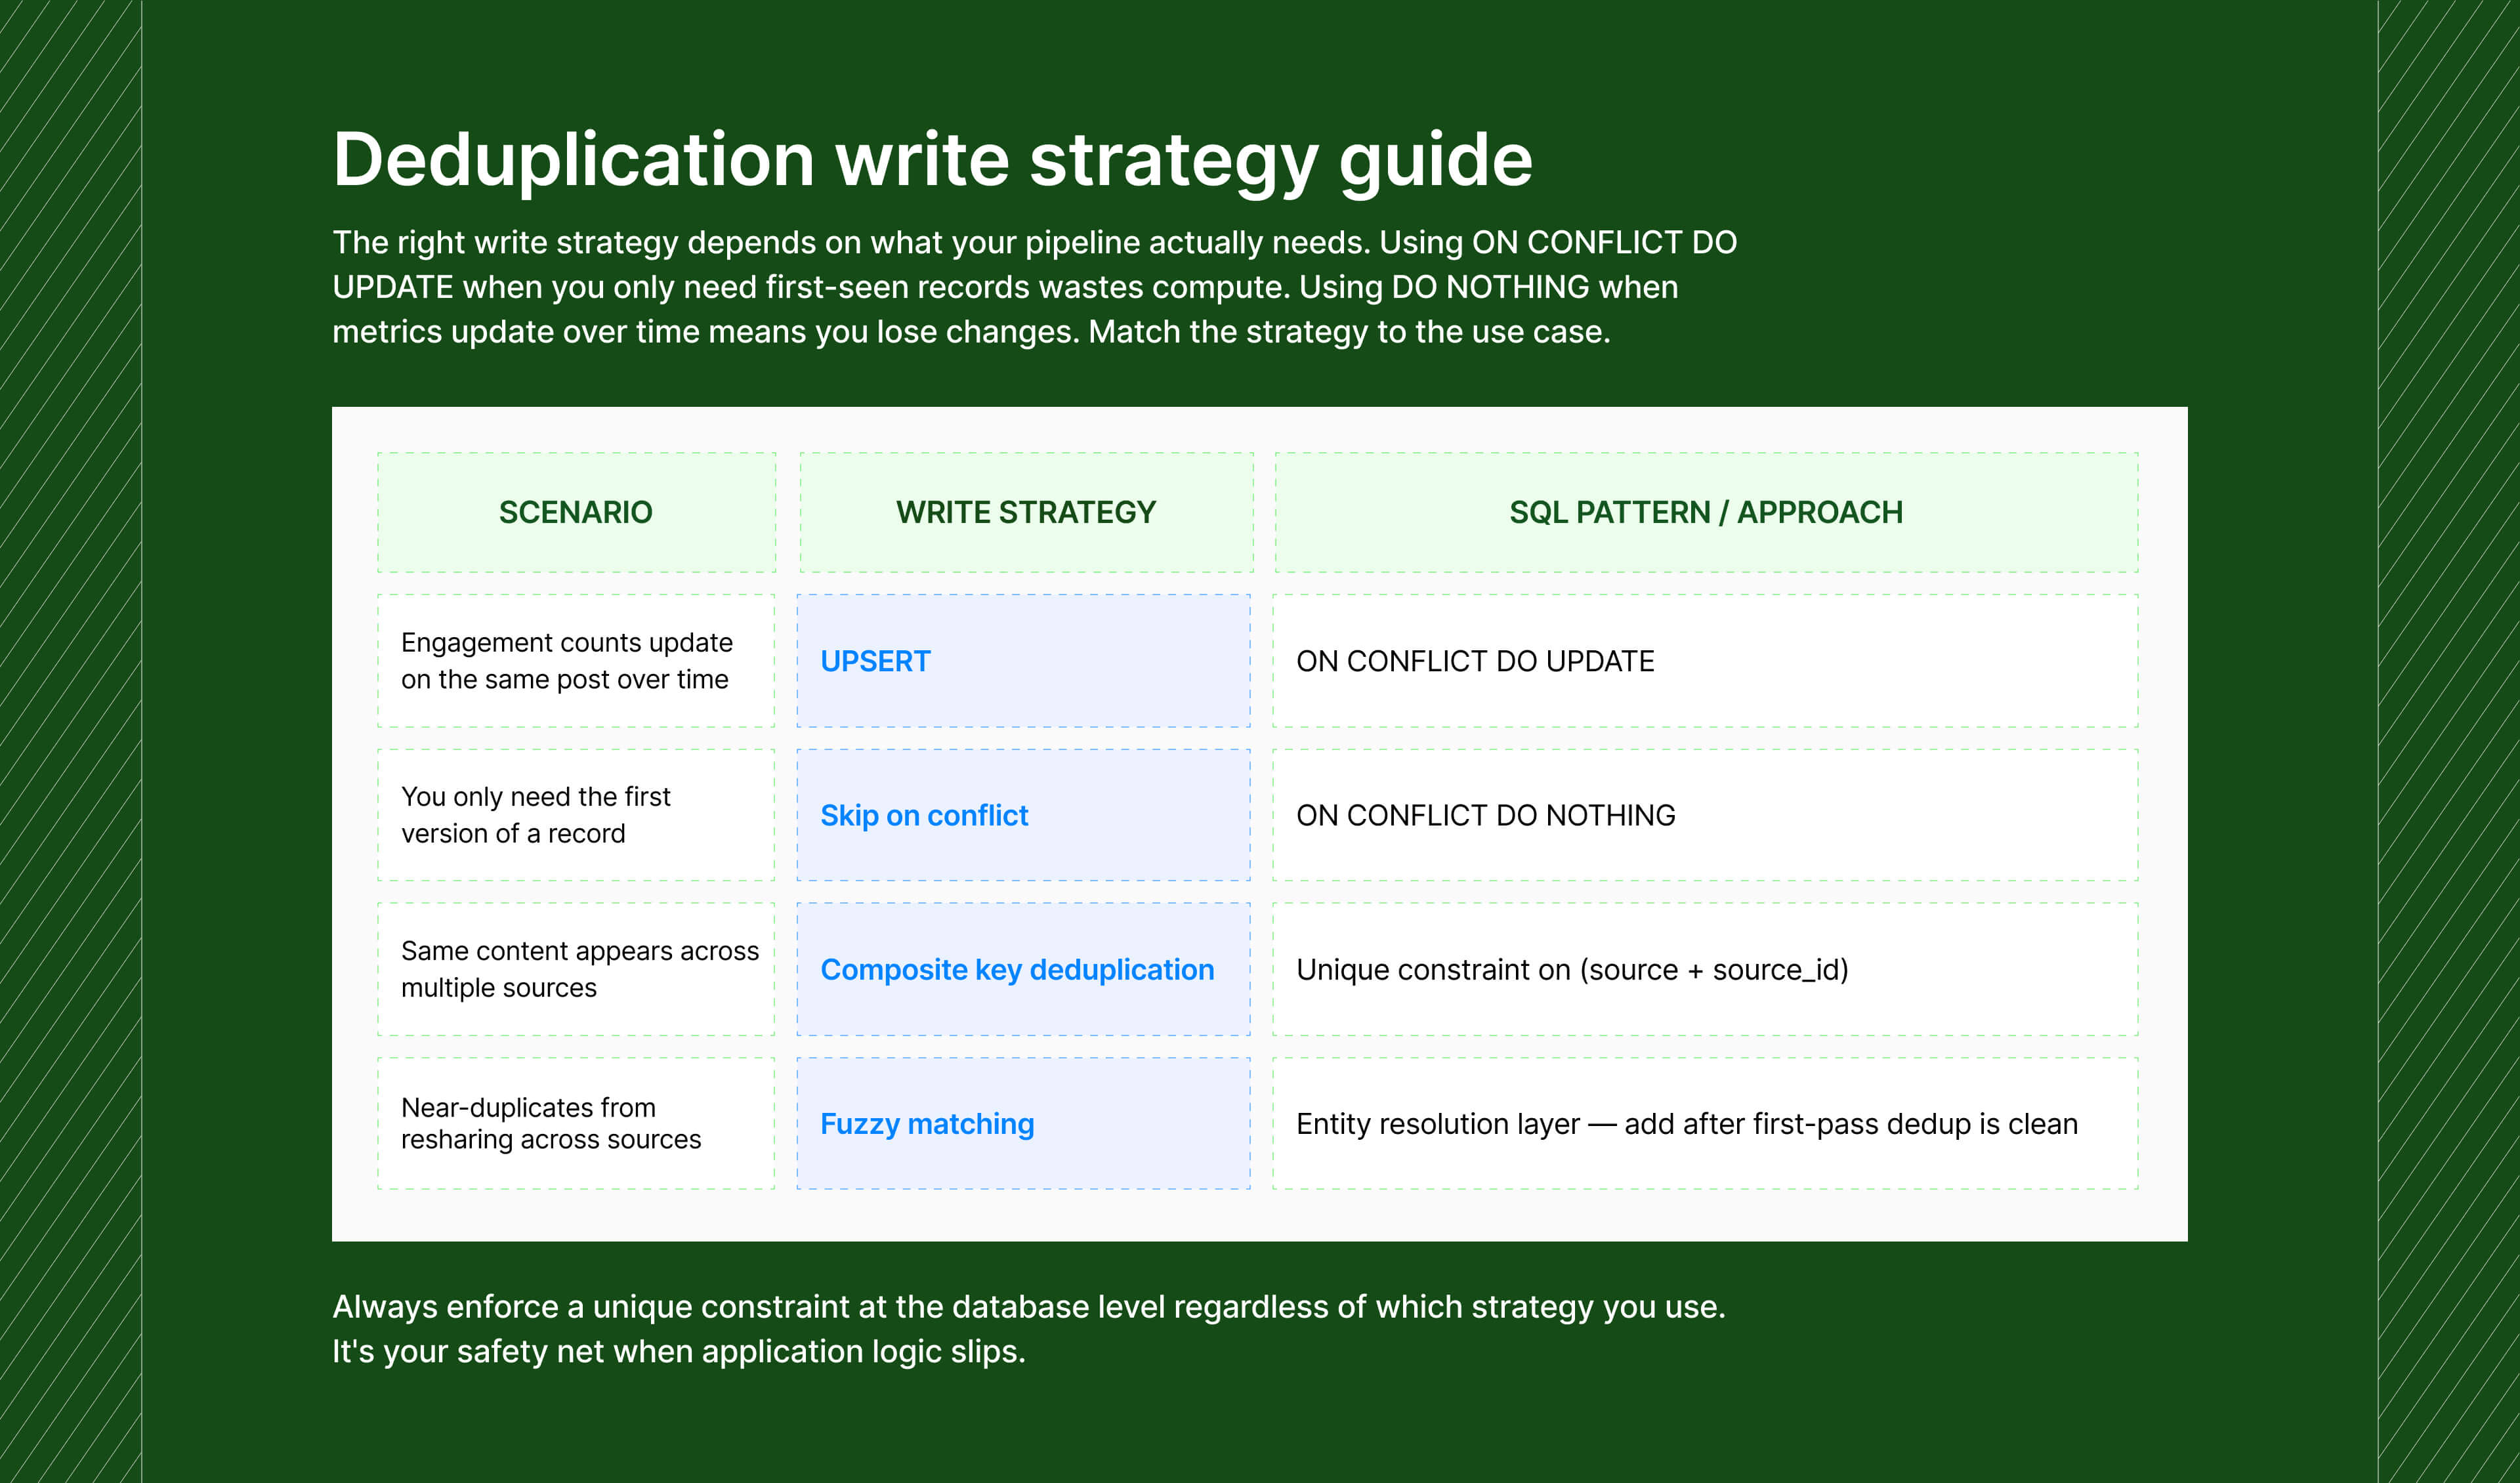
→ Write strategy by use case
-- Use when a record's metrics can change after first ingestion
-- (e.g. engagement count updating on the same post ID)
INSERT INTO posts (...) VALUES (...)
ON CONFLICT (source_id) DO UPDATE SET
engagement_count = EXCLUDED.engagement_count,
updated_at = EXCLUDED.updated_at;
-- Use when you only need the first version of a record
INSERT INTO posts (...) VALUES (...)
ON CONFLICT (source_id) DO NOTHING;
For near-duplicates (the same content appearing across sources with minor variations) fuzzy matching and entity resolution add real complexity.
Add them if coverage accuracy is a core part of your product. Skip them until the first-pass deduplication is working cleanly.
Another fix: switch from full reloads to incremental loading
Full dataset reloads on every run are one of the biggest sources of unnecessary duplication.
Watermark-based incremental loading is the alternative: store the timestamp or ID of the last successfully processed record, and on the next run only pull records newer than that marker.
→ Watermark-based incremental loading
-- Extract only new/updated records
SELECT * FROM source_api
WHERE updated_at > (
SELECT watermark FROM control_table WHERE source = 'source_name'
);
-- After a successful load, advance the watermark
UPDATE control_table
SET watermark = (SELECT MAX(updated_at) FROM staging_table)
WHERE source = 'source_name';
⚡ A quick warning: Don't set your watermark using CURRENT_TIMESTAMP() or NOW() inside the job. If you do, a retry creates a different timestamp than the original run – the job isn't idempotent, and failure-then-retry introduces gaps. Use the logical execution date from your orchestrator (Airflow's execution_date, Prefect's scheduled_start_time) instead. This represents the time period the data covers, not when the code ran.
✓ Signal to watch: Duplicate rate per source. If it's above zero, your ingestion boundary has a gap somewhere.
The underlying principle here is idempotency: designing your pipeline so that running the same job twice with the same inputs always produces the same output. A job that isn't idempotent turns every retry into a potential data quality incident.
Fix 2: Build retry logic that knows the difference between a timeout and a dead end
What goes wrong without it
Rate limits are a pretty routine operating condition when it comes to social media data.
The most common version of broken retry logic: a try/catch with a fixed 5-second sleep before retrying.
The problem is that this treats all failures identically. A 429 (rate limited) and a 401 (invalid credentials) get the same response (retry) but only one of them will ever succeed with retrying.
And burning retry attempts on a permanent failure delays diagnosis and wastes resources.
How to fix it
Step 1: IImplement exponential backoff (gradually increasing wait time between retry attempts, up to a cap) with jitter for transient failures
Exponential backoff doubles the wait between each retry attempt, up to a cap.
Jitter adds a small random offset to prevent the thundering herd problem – where all workers back off for the same fixed delay, then simultaneously retry, causing another rate limit spike.
→ Exponential backoff with jitter
delay = min(base_delay × 2^attempt, max_delay) + random(0, base_delay × 0.1)
Example sequence with base=1s, max=60s:
Attempt 1 → wait ~1s
Attempt 2 → wait ~2s
Attempt 3 → wait ~4s
Attempt 4 → wait ~8s
Attempt 5 → wait ~16s, then give up
Set max_delay to match the rate limit reset window of the API.
Some reset every 15 minutes; some every hour.
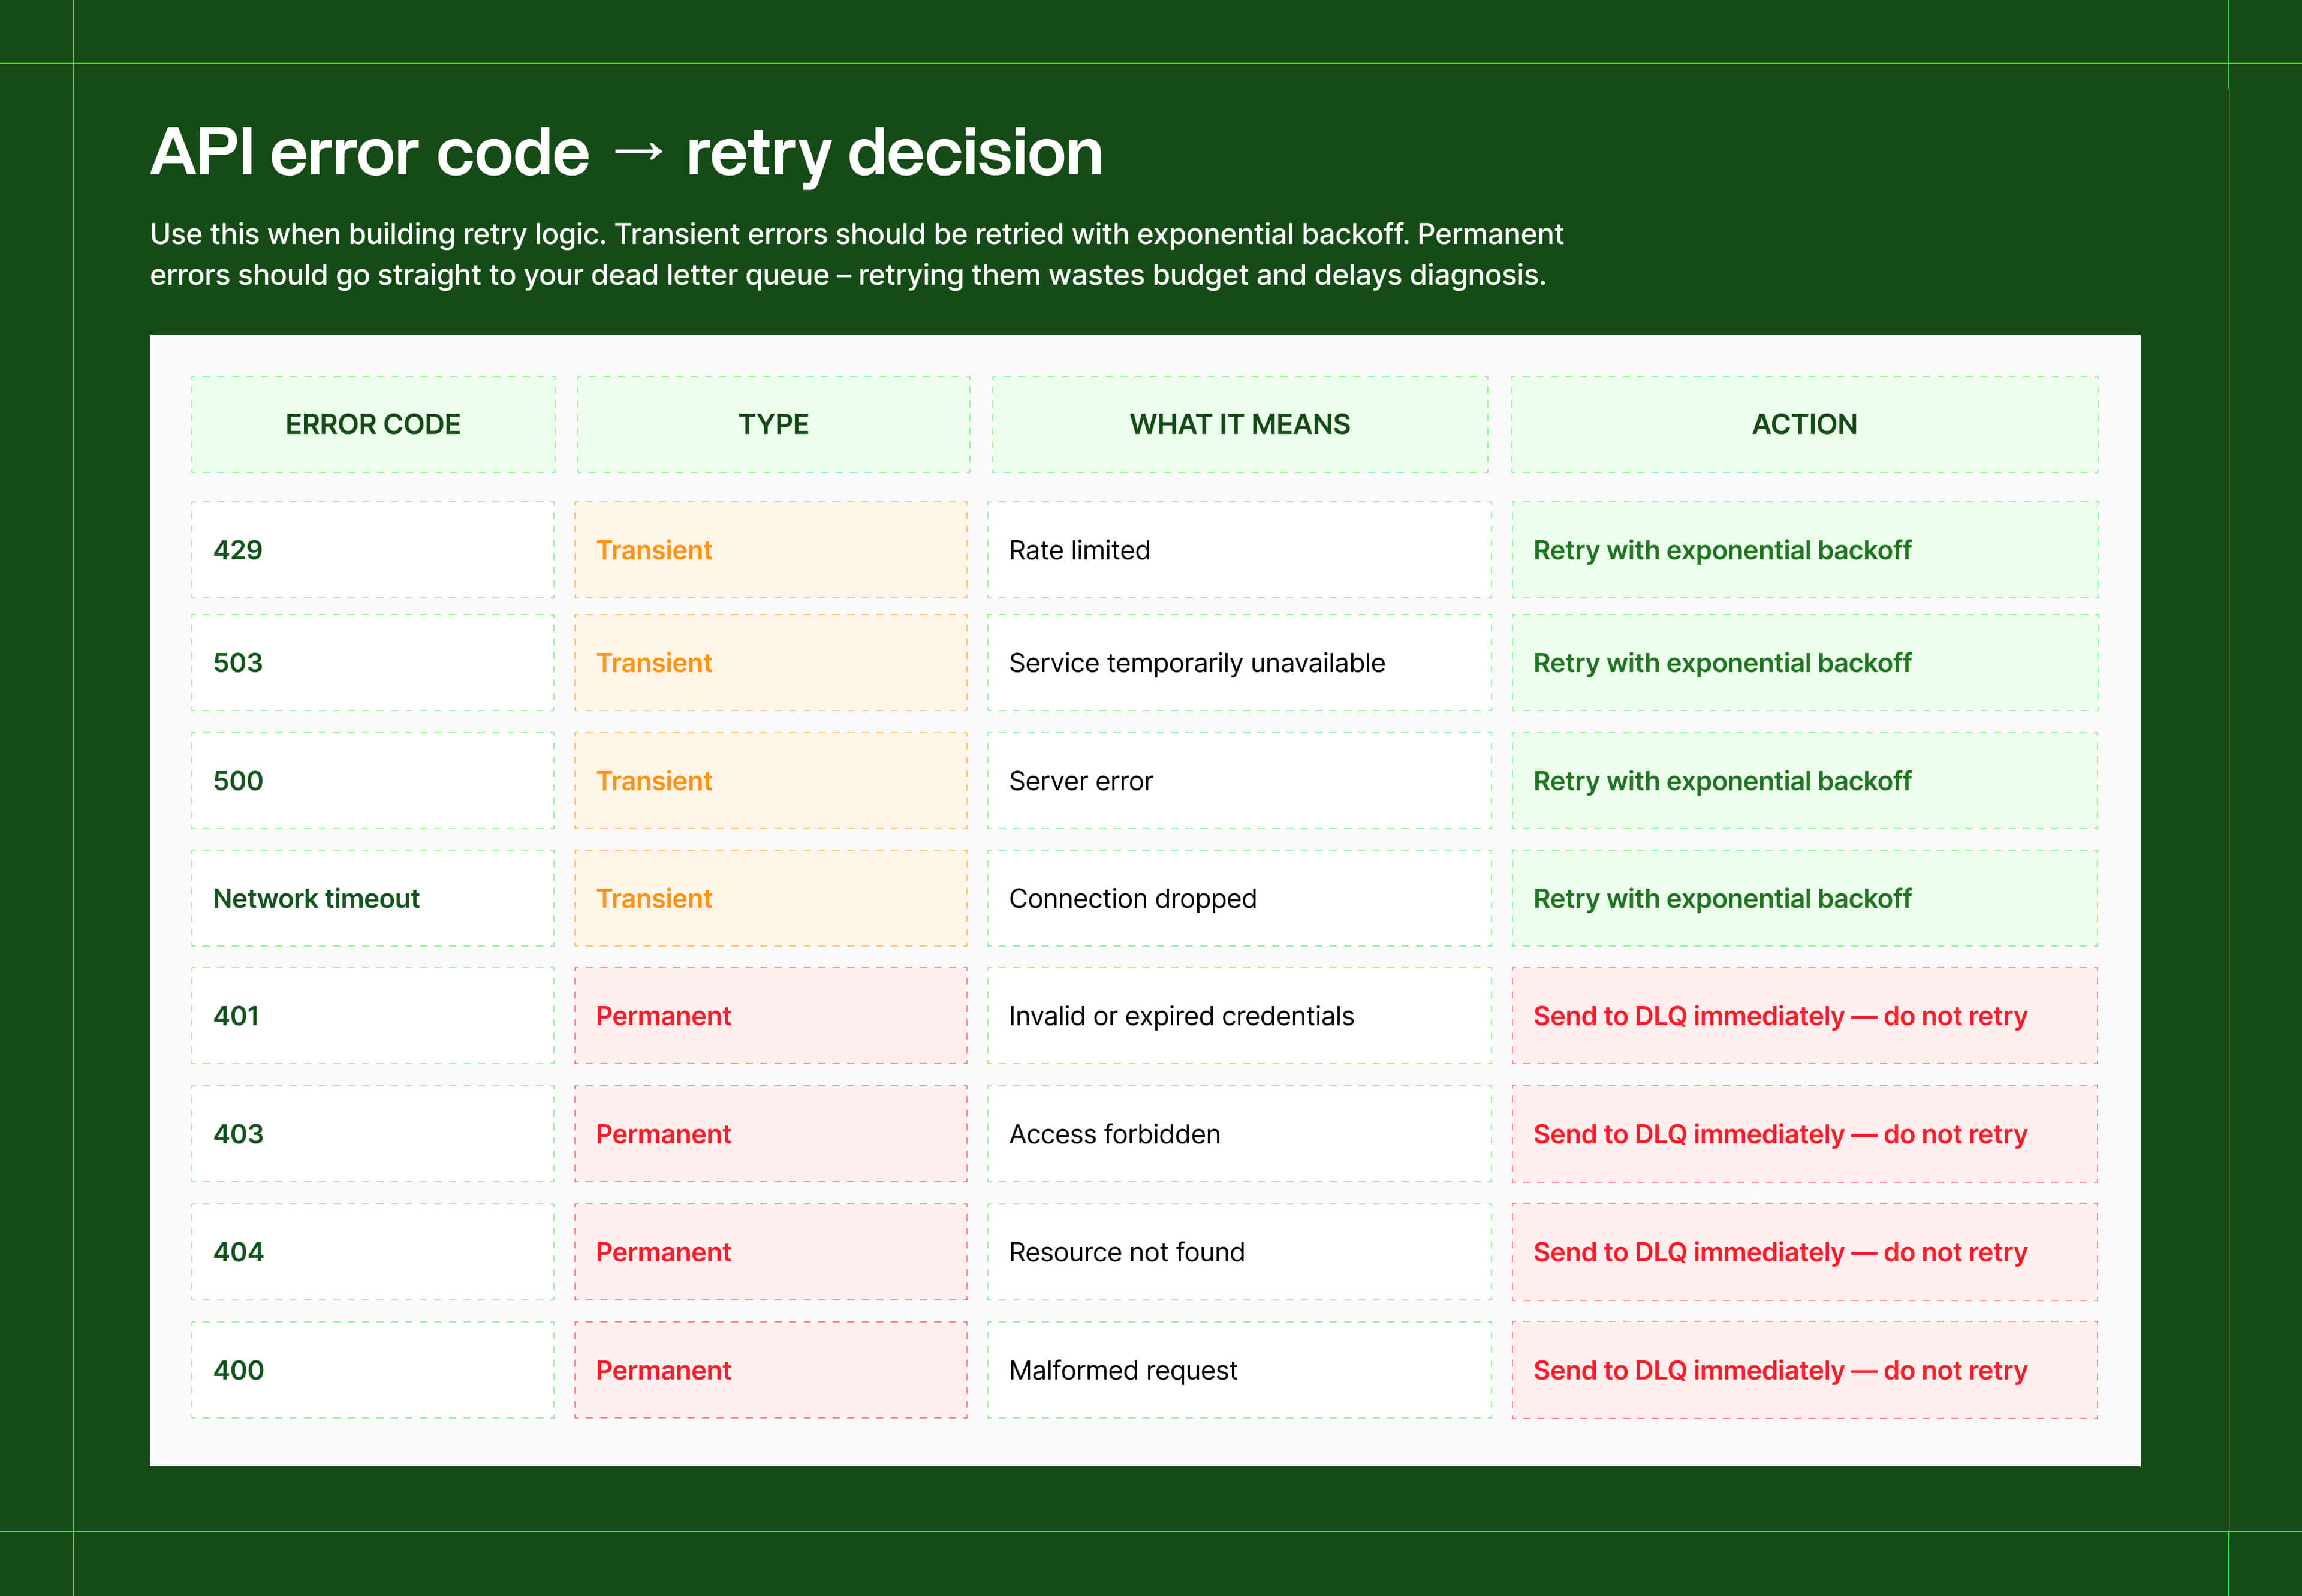
Step 2: Separate transient failures from permanent ones
- Retry: 429 (rate limited), 503 (service unavailable), network timeouts, 500 (server error) – these are temporary conditions that may resolve on the next attempt
- Don't retry: 401 (invalid credentials), 403 (forbidden), 404 (resource not found), 400 (bad request) – these will fail every time regardless of how many attempts you make
If you get a 401, retrying is pointless, the credential is expired or wrong. Stop immediately, log it, and route it to your dead letter queue.
Step 3: Set up a dead letter queue (DLQ) for failures that exhaust retries
A DLQ is a separate queue or table where unresolvable failures land, preserving the original request so you can investigate or replay them later. Without one, permanent failures just vanish with no record of what was lost.
A useful DLQ record captures:
→ Minimum viable DLQ payload
{
"source": "source_name",
"endpoint": "/v2/posts/search",
"error_code": 401,
"error_message": "Token expired",
"attempts": 1,
"first_attempted_at": "2026-05-07T09:00:00Z",
"original_payload": { "query": "...", "since": "..." }
}
If you're using BullMQ, Sidekiq, or Celery, these frameworks handle retry config, concurrency control, and DLQ routing out of the box. Check what your framework provides before building this yourself.
Step 4: Add a circuit breaker for persistent source failures
If a source is returning errors on more than 80% of requests over a sustained window, stop sending requests entirely. Continuing to hammer a struggling API doesn't help it recover, it worsens the queue buildup on your end.
A simple implementation: track error rate per source in a rolling 5-minute window. If it exceeds your threshold, set a circuit_open flag for that source and skip collection for a defined cooldown – — 10 to 30 minutes is typical. Check again after cooldown. If the error rate has dropped, close the circuit and resume.
✓ Signal to watch: DLQ volume over time, split by error type. A spike in 401s usually means a token rotation went wrong. A spike in 404s usually means an endpoint changed.
Fix 3: Schema drift will break your pipeline, here’s how to find it first
An upstream API ships a change: a field gets renamed, a data type shifts from string to integer, or a previously optional field becomes required.
Your pipeline keeps running without error fires. But your transformation logic is now writing nulls into fields that should have values, or silently dropping a field your downstream models depend on.
You find out when a dashboard shows unexpected results, often weeks after the change happened. By then, the bad data has propagated. ⚠️
How to fix it
Step 1: Compare incoming schema against expected schema at ingestion
Schema monitoring needs to run on every pipeline execution, not as a periodic audit.
Parse the schema of each incoming API response and diff it against a stored reference schema. Any mismatch gets classified and routed based on severity.
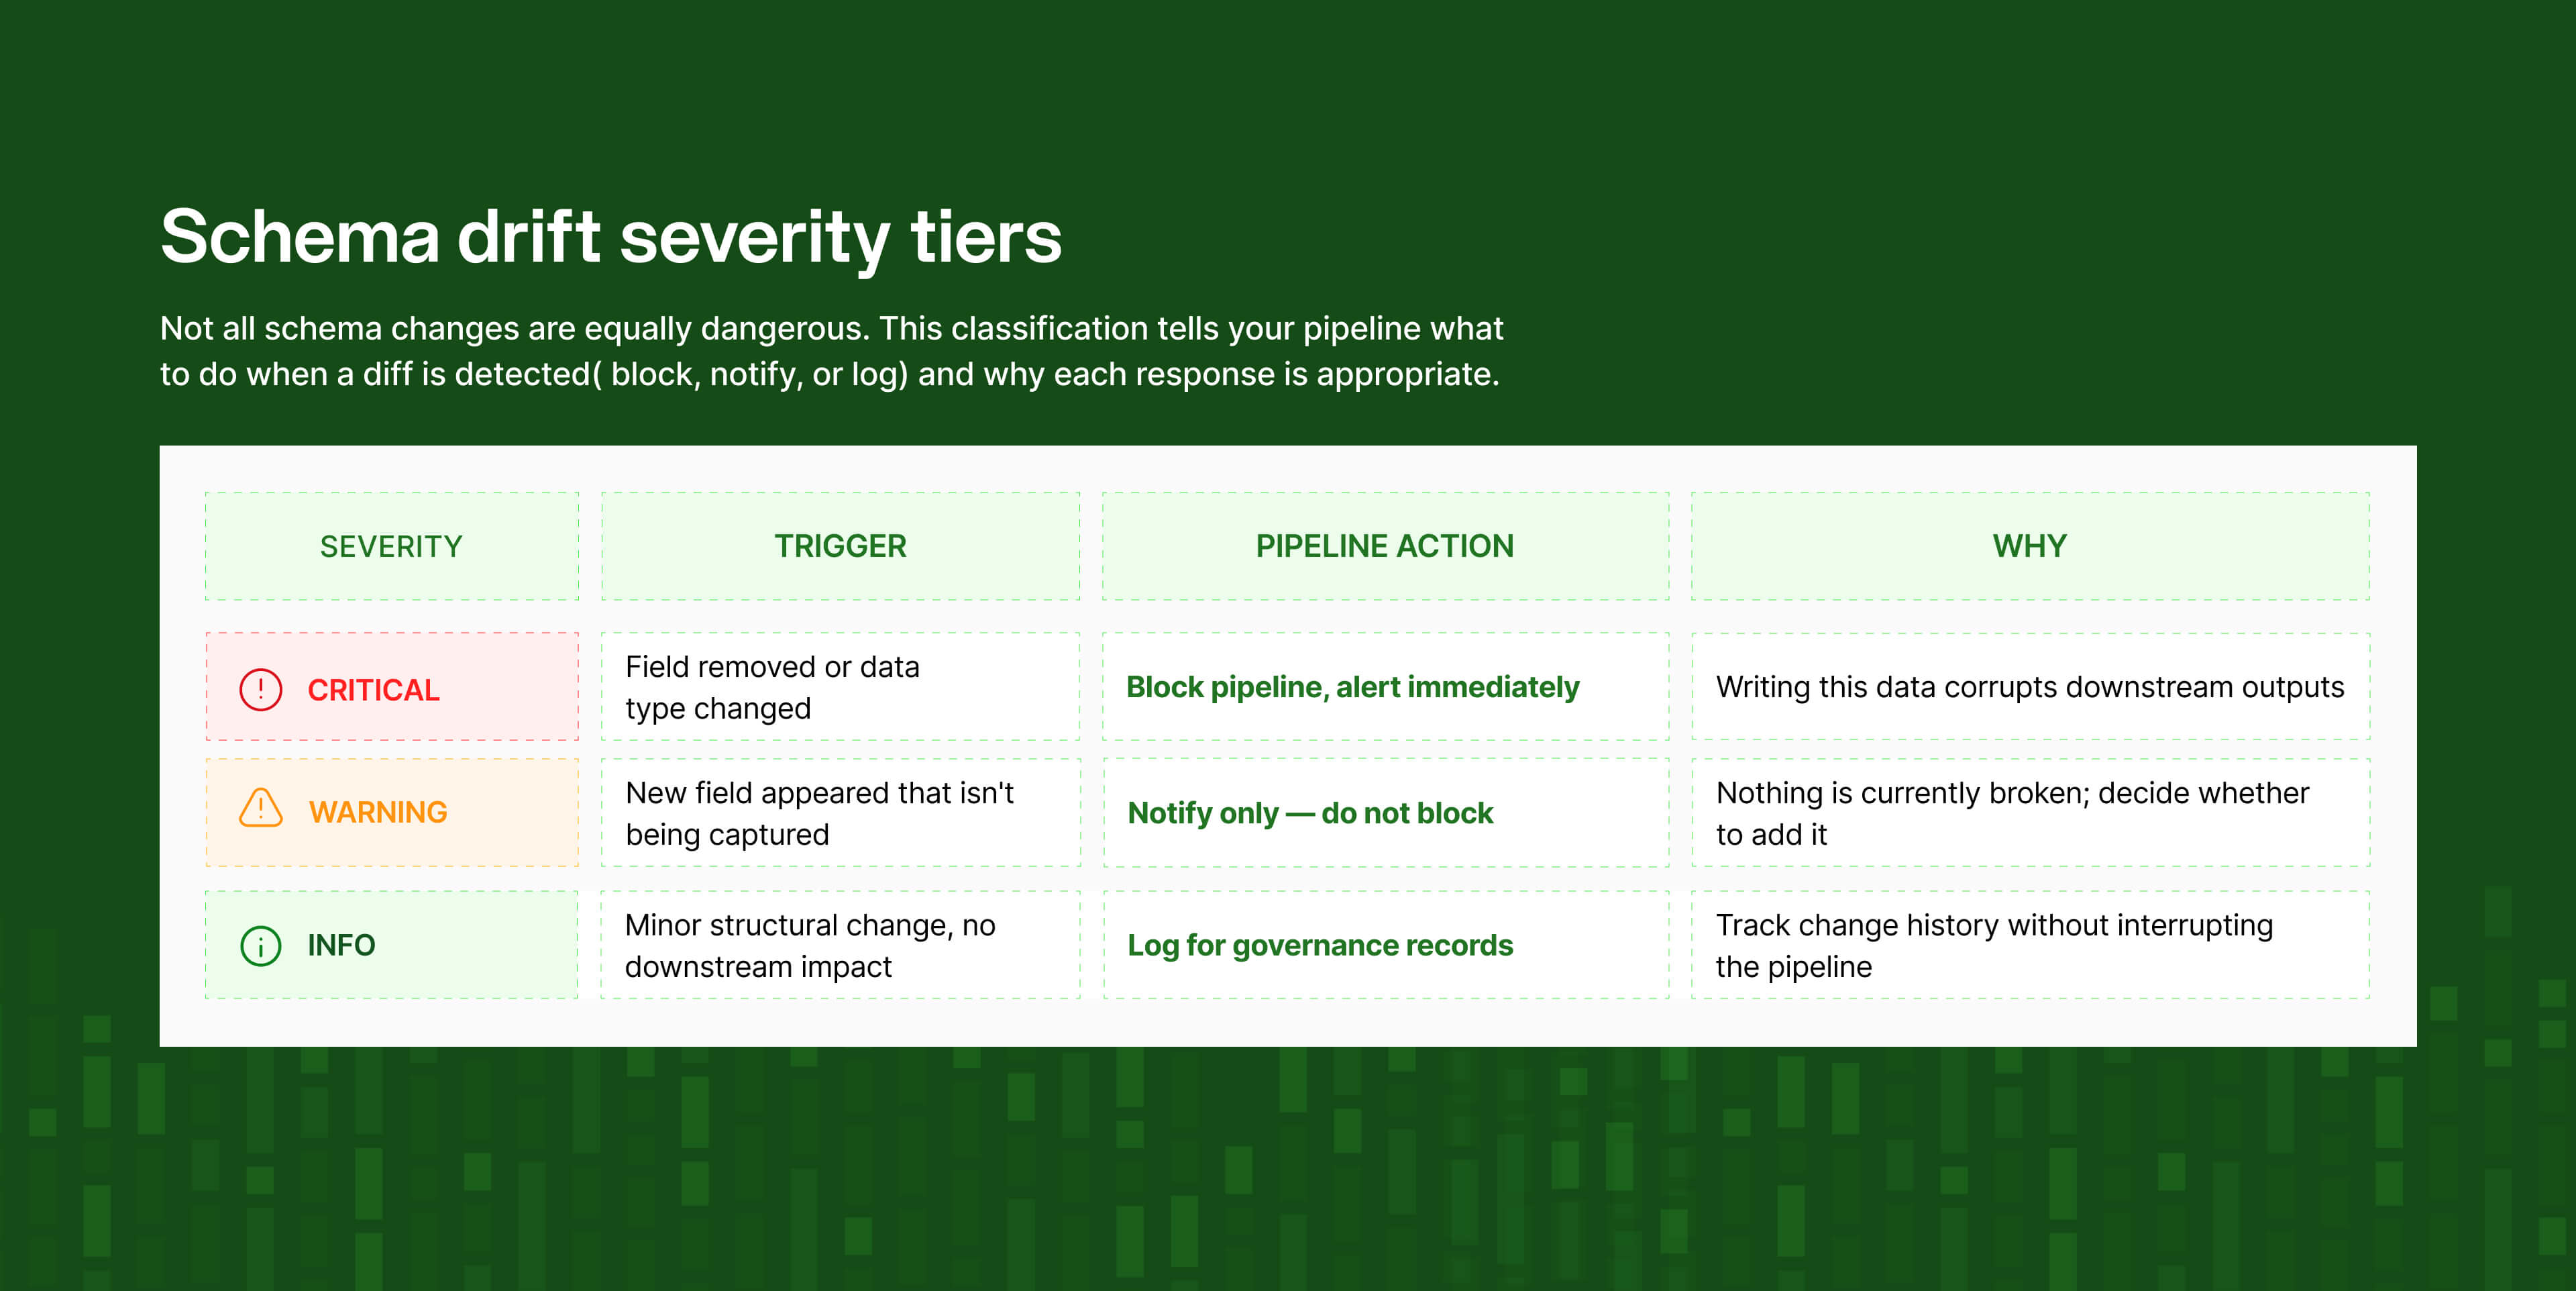
Step 2: Classify drift by severity and respond differently to each
Not all schema changes are equally dangerous:
→ Severity classification
CRITICAL A field your pipeline explicitly references has been removed or changed type.
Action: block the pipeline, alert immediately.
Why: writing this data will corrupt downstream outputs.
WARNING A new field appeared that you're not currently capturing.
Action: notify, do not block.
Why: you may want to add it, but nothing is currently broken.
INFO A minor structural change with no downstream impact.
Action: log it for governance records.
Why: track change history without interrupting the pipeline.
Step 3: Enable schema evolution carefully with a diff log
Modern lakehouse formats like Delta Lake and Apache Iceberg support automatic schema evolution – they absorb additive changes like new columns without requiring ALTER TABLE. This is useful for handling WARNING-level drift automatically.
⚡ A quick warning: If an upstream API bug accidentally generates a junk column, auto-evolution will silently add it to your production schema. Always maintain a diff log alongside auto-evolution: what column changed, when, and triggered by which pipeline run.
Step 4 (if you're using dbt): encode your expected schema as tests
Four test types cover the most critical schema expectations:
- not_null on any field your downstream models depend on;
- accepted_values for fields with a defined value set (status fields, content type enums);
- relationships for foreign keys;
- and source freshness to catch stale data before it reaches your models.
These run on every build, fail loudly, are version-controlled, and visible to the whole team – the lowest-effort path to continuous schema monitoring if you're already in the dbt ecosystem.
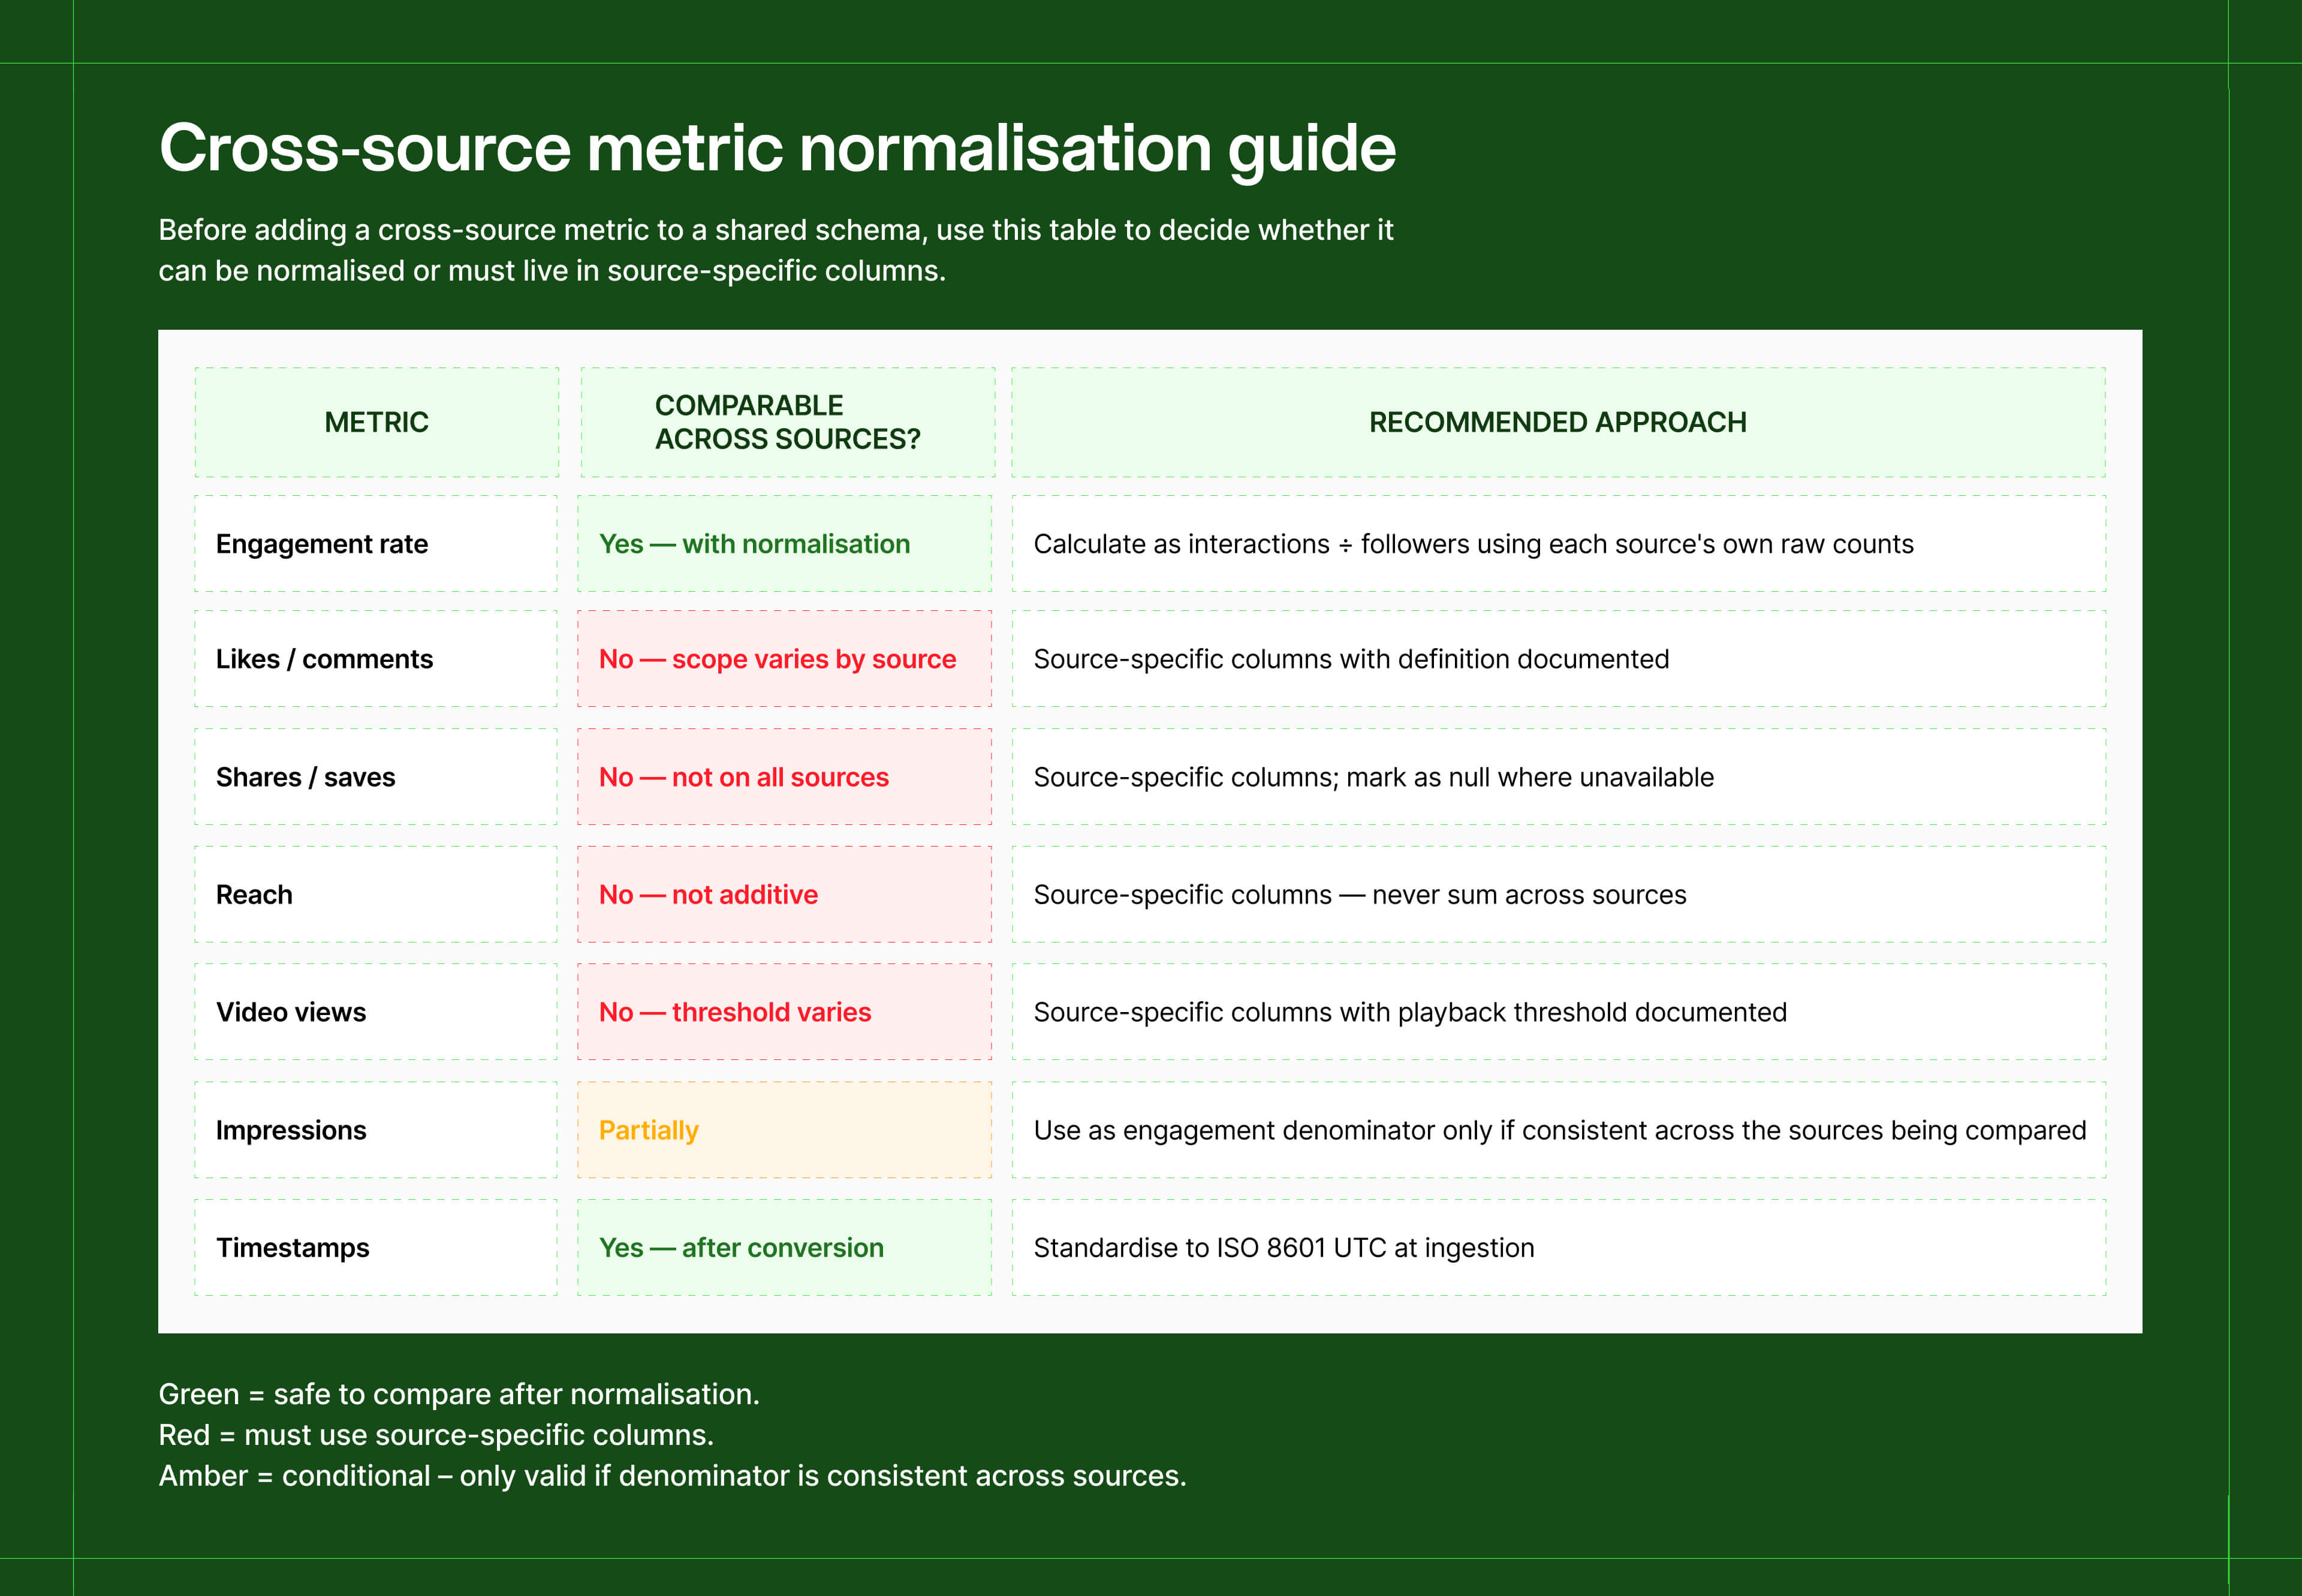
Fix 4: If your metrics don't mean the same thing across sources, cross-source analysis is broken
Social data from different sources lands in the same table. A stakeholder runs a cross-source comparison. The numbers look comparable because they share column names. They're not, and this produces misleading analysis consistently.
Here's why:
- Engagement means something different on every source. On some, it includes saves, shares, and link clicks. On others, it's only likes and comments. The same column name, completely different scope.
- Reach isn't additive. The same user appearing on two different sources contributes to both reach counts – summing them double-counts people, not audiences.
- Video views have no universal definition. One source counts a 2-second view; another requires 30 seconds of watch time. The number in your table reflects whichever threshold that source uses, which you may not have documented.
One analysis found the same engagement metric, for the same industry, returned 0.26% from one methodology and 3.80% from another – a 14x difference, both technically correct.
How to fix it
Step 1: Normalise engagement at the transformation layer
Calculate a normalised engagement rate using each source's raw interaction counts, divided by a consistent denominator. You're giving every source the same measurement framework so they can be compared honestly.
→ Normalised engagement rate across sources
SELECT
post_id,
source,
(likes + comments + shares + saves) AS total_interactions,
followers,
ROUND(
(likes + comments + shares + saves)::numeric / NULLIF(followers, 0) * 100,
2
) AS engagement_rate_pct
FROM posts;
-- Document per-source what counts as 'interactions':
-- Source A: likes + comments only
-- Source B: likes + comments + shares + saves
Step 2: For non-comparable metrics, use source-specific column names
Reach, video views, and similar metrics shouldn't live in a shared column that silently means different things depending on the row. Name them by source, and add the definition as a comment in your schema or data dictionary.
→ Naming non-comparable metrics
✓ reach_source_a — definition: unique accounts reached (deduplicated)
✓ video_views_source_b — definition: views lasting ≥ 3 seconds
✗ reach — whose definition? which threshold?
✗ video_views — 2 seconds? 30 seconds? full completion?
Step 3: Standardise timestamps to UTC at ingestion
Mixing time zones across sources causes join failures and off-by-one errors in time-series queries. Convert everything to ISO 8601 UTC the moment it enters your pipeline, not at query time.
Apply this logic once, centrally, at the transformation layer, not scattered across application code. Because if your definition of "engagement" lives in five places, it will eventually drift into five different definitions.
✓ What this changes downstream: When a stakeholder asks 'is this cross-source comparison valid?', the answer comes straight from your schema documentation.
Fix 5: If clients are your monitoring system, you don't have a monitoring system
The failure pattern here is always the same: you find out there's a problem when a client flags it.
By that point, data has been missing for hours, sometimes days. You spend time diagnosing, explaining, and rebuilding trust that a well-configured alert would have caught at hour one.
A Forrester survey over 25% of organizations lose more than $5 million annually to poor data quality. That figure is the cumulative cost of slow, undetected degradation.
How to fix it
The majority of teams tend to monitor one thing: did the job finish? A job can complete successfully and still leave you with a table full of nulls, a 30% volume drop, or data that's 6 hours stale.
The most useful mental model is to treat your pipeline like a service with informal SLOs (Service Level Objectives).
Instead of 'we monitor the pipeline', you're committing to: data will be no more than 90 minutes stale; volume will not drop more than 20% below baseline; null rates on key fields will stay below 5%. These are commitments you can communicate to product and engineering teams, and escalate when breached.
Step 1: Monitor five dimensions, not just whether the job ran
A job can complete successfully and still leave you with a table full of nulls, a 30% volume drop, or data that's 6 hours stale.
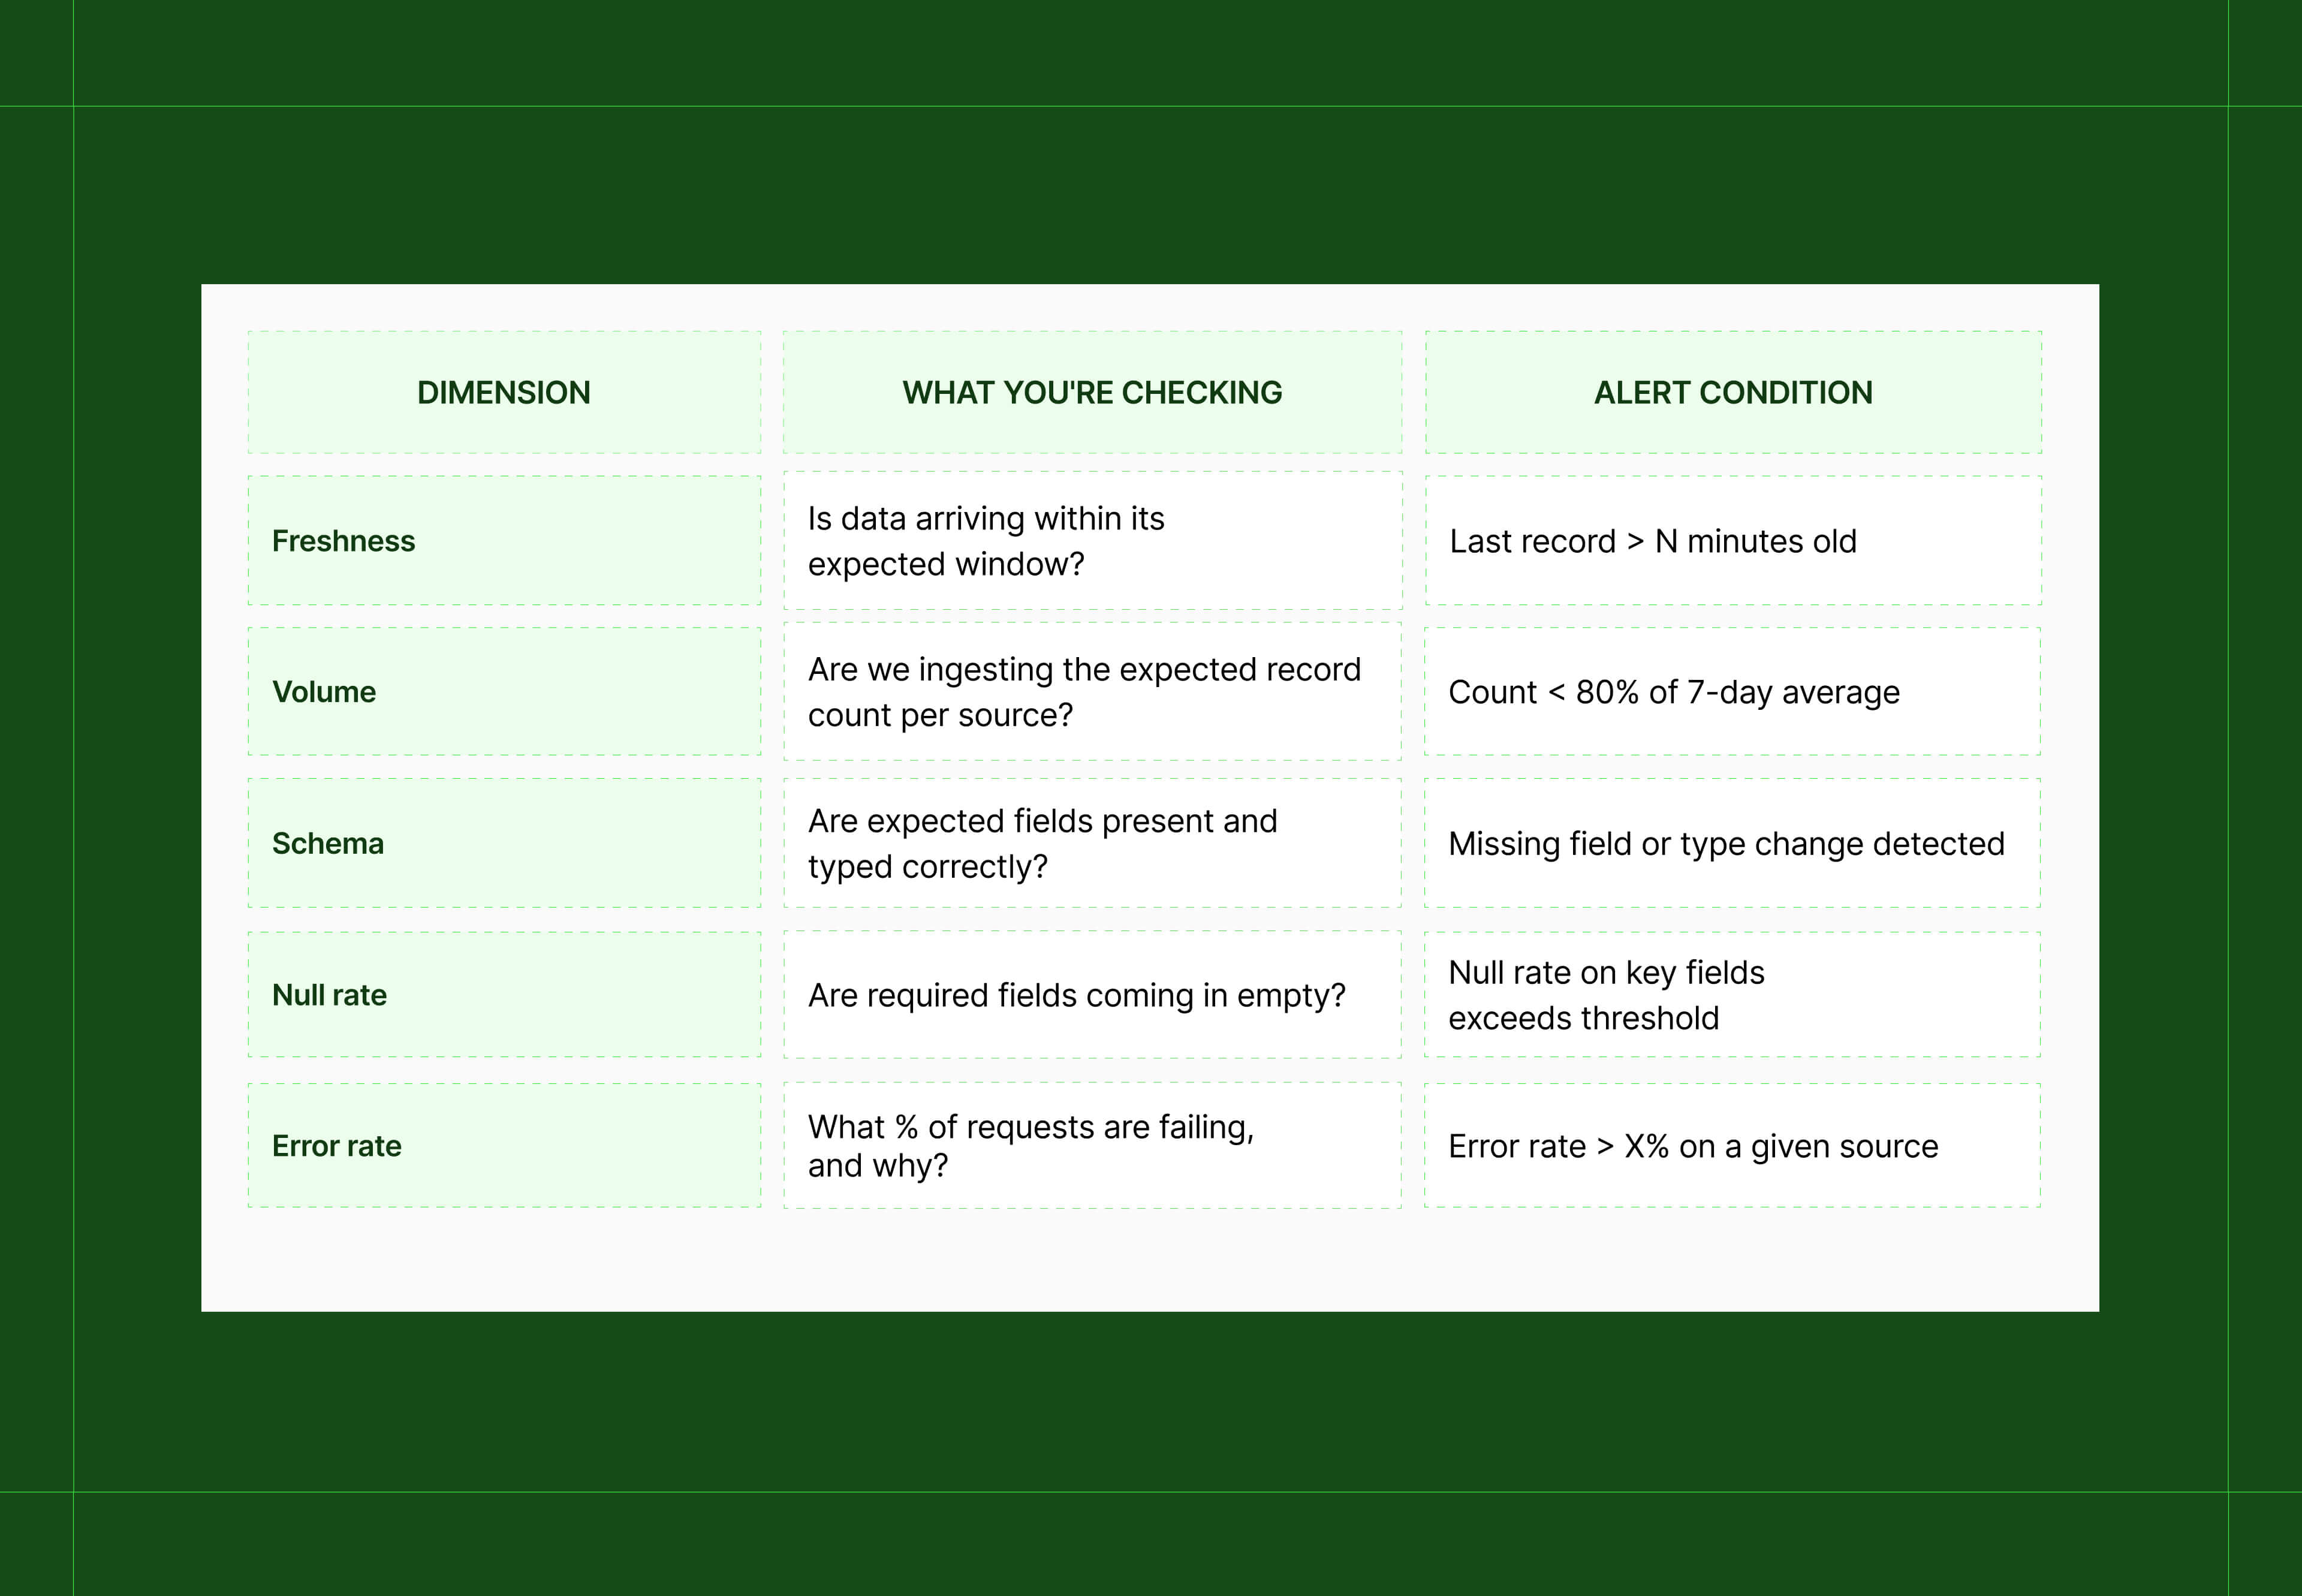
Step 2: Implement alerting rules, without a dedicated tool if needed
Dedicated observability platforms set these thresholds dynamically. But you can get meaningful coverage with SQL-based rules built on these five dimensions:
→ Basic alerting rules (implementable in SQL or your orchestrator)
-- Freshness: alert if no new records within expected window
SELECT source FROM pipeline_runs
WHERE MAX(ingested_at) < NOW() - INTERVAL '90 minutes'
GROUP BY source;
-- Volume: alert if today's count drops below 80% of 7-day average
SELECT source FROM daily_ingestion_summary
WHERE today_count < avg_7d * 0.8;
-- Null rate: alert if key fields arrive empty
SELECT COUNT(*) FILTER (WHERE key_field IS NULL)::float / COUNT(*) AS null_rate
FROM ingested_records WHERE ingested_at > NOW() - INTERVAL '1 hour';
Step 3: Log structured fields, not string messages
When something breaks, structured logs with queryable fields (source, error_type, timestamp, retry_count, endpoint) are the difference between a 10-minute investigation and a two-hour reconstruction.
→ Structured log format
{
"level": "error",
"source": "source_name",
"endpoint": "/v2/posts/search",
"error_type": "rate_limit",
"status_code": 429,
"retry_count": 3,
"timestamp": "2026-05-07T09:15:00Z"
}
Step 4: Version-control your pipeline configuration
When a breakage correlates with a recent code change, having a clean commit history cuts root cause analysis into a clear sequence. So pipeline configs that live outside version control are a maintenance blind spot.
Fix 6: Do a coverage audit, because you probably don't know exactly what your pipeline captures
What goes wrong without it
Every social data pipeline has gaps. But we’re betting your team hasn’t fully mapped them yet.
The risk isn't the gaps themselves, it's building products or making decisions on assumed completeness that isn't there.
Missing content formats
Many sources don't expose all content formats via their standard API endpoints. Short-form video, stories, and live streams are commonly excluded or only partially accessible, meaning a significant slice of engagement activity simply isn't in your pipeline.
Short historical depth
Historical depth is another one: most sources cap how far back you can query, and that window is often shorter than clients assume when they're asking for trend analysis or year-on-year comparisons.
Rate limits
Then there's the problem with rate limits. Because you're pulling data in batches rather than a continuous stream, high-volume periods create gaps in coverage that a real-time feed would catch but a scheduled pull misses entirely.
Post-level vs account-level rate limits
This one trips up product teams specifically: many sources apply separate, stricter rate limits to account-level endpoints (follower counts, profile metadata, historical post archives) than to search or feed endpoints. Your post-level coverage may look complete while your account-level data has systematic gaps – particularly for high-volume accounts where limits are hit fastest.
None of these are fixable by improving pipeline code, they're constraints from the data sources themselves. But undocumented, they become invisible assumptions that propagate through every product, model, and report built on top of your data.
How to fix it
Step 1: Run the audit
Work through these questions for each source:
- Which content formats are fully ingested? Which are partial or excluded entirely?
- What is the available historical depth? Is it consistent or does it vary by source?
- Which metrics are exact values vs. estimates or approximations?
- What is the typical latency from content creation to ingestion?
- What happens when the source is unavailable – is there a retry window? Is the gap logged?
- Are there restrictions affecting collection (region, language, account type, content type)?
- Are there separate rate limits for account-level vs. post-level endpoints?
💡For a deeper audit of what your data is actually capturing (and what it isn't) read our social data coverage evaluation framework.
Step 2: Document each gap with a standard format
A gap entry should be specific enough that an engineer, PM, and client can all understand its impact:
→ Documented gap entry – example format
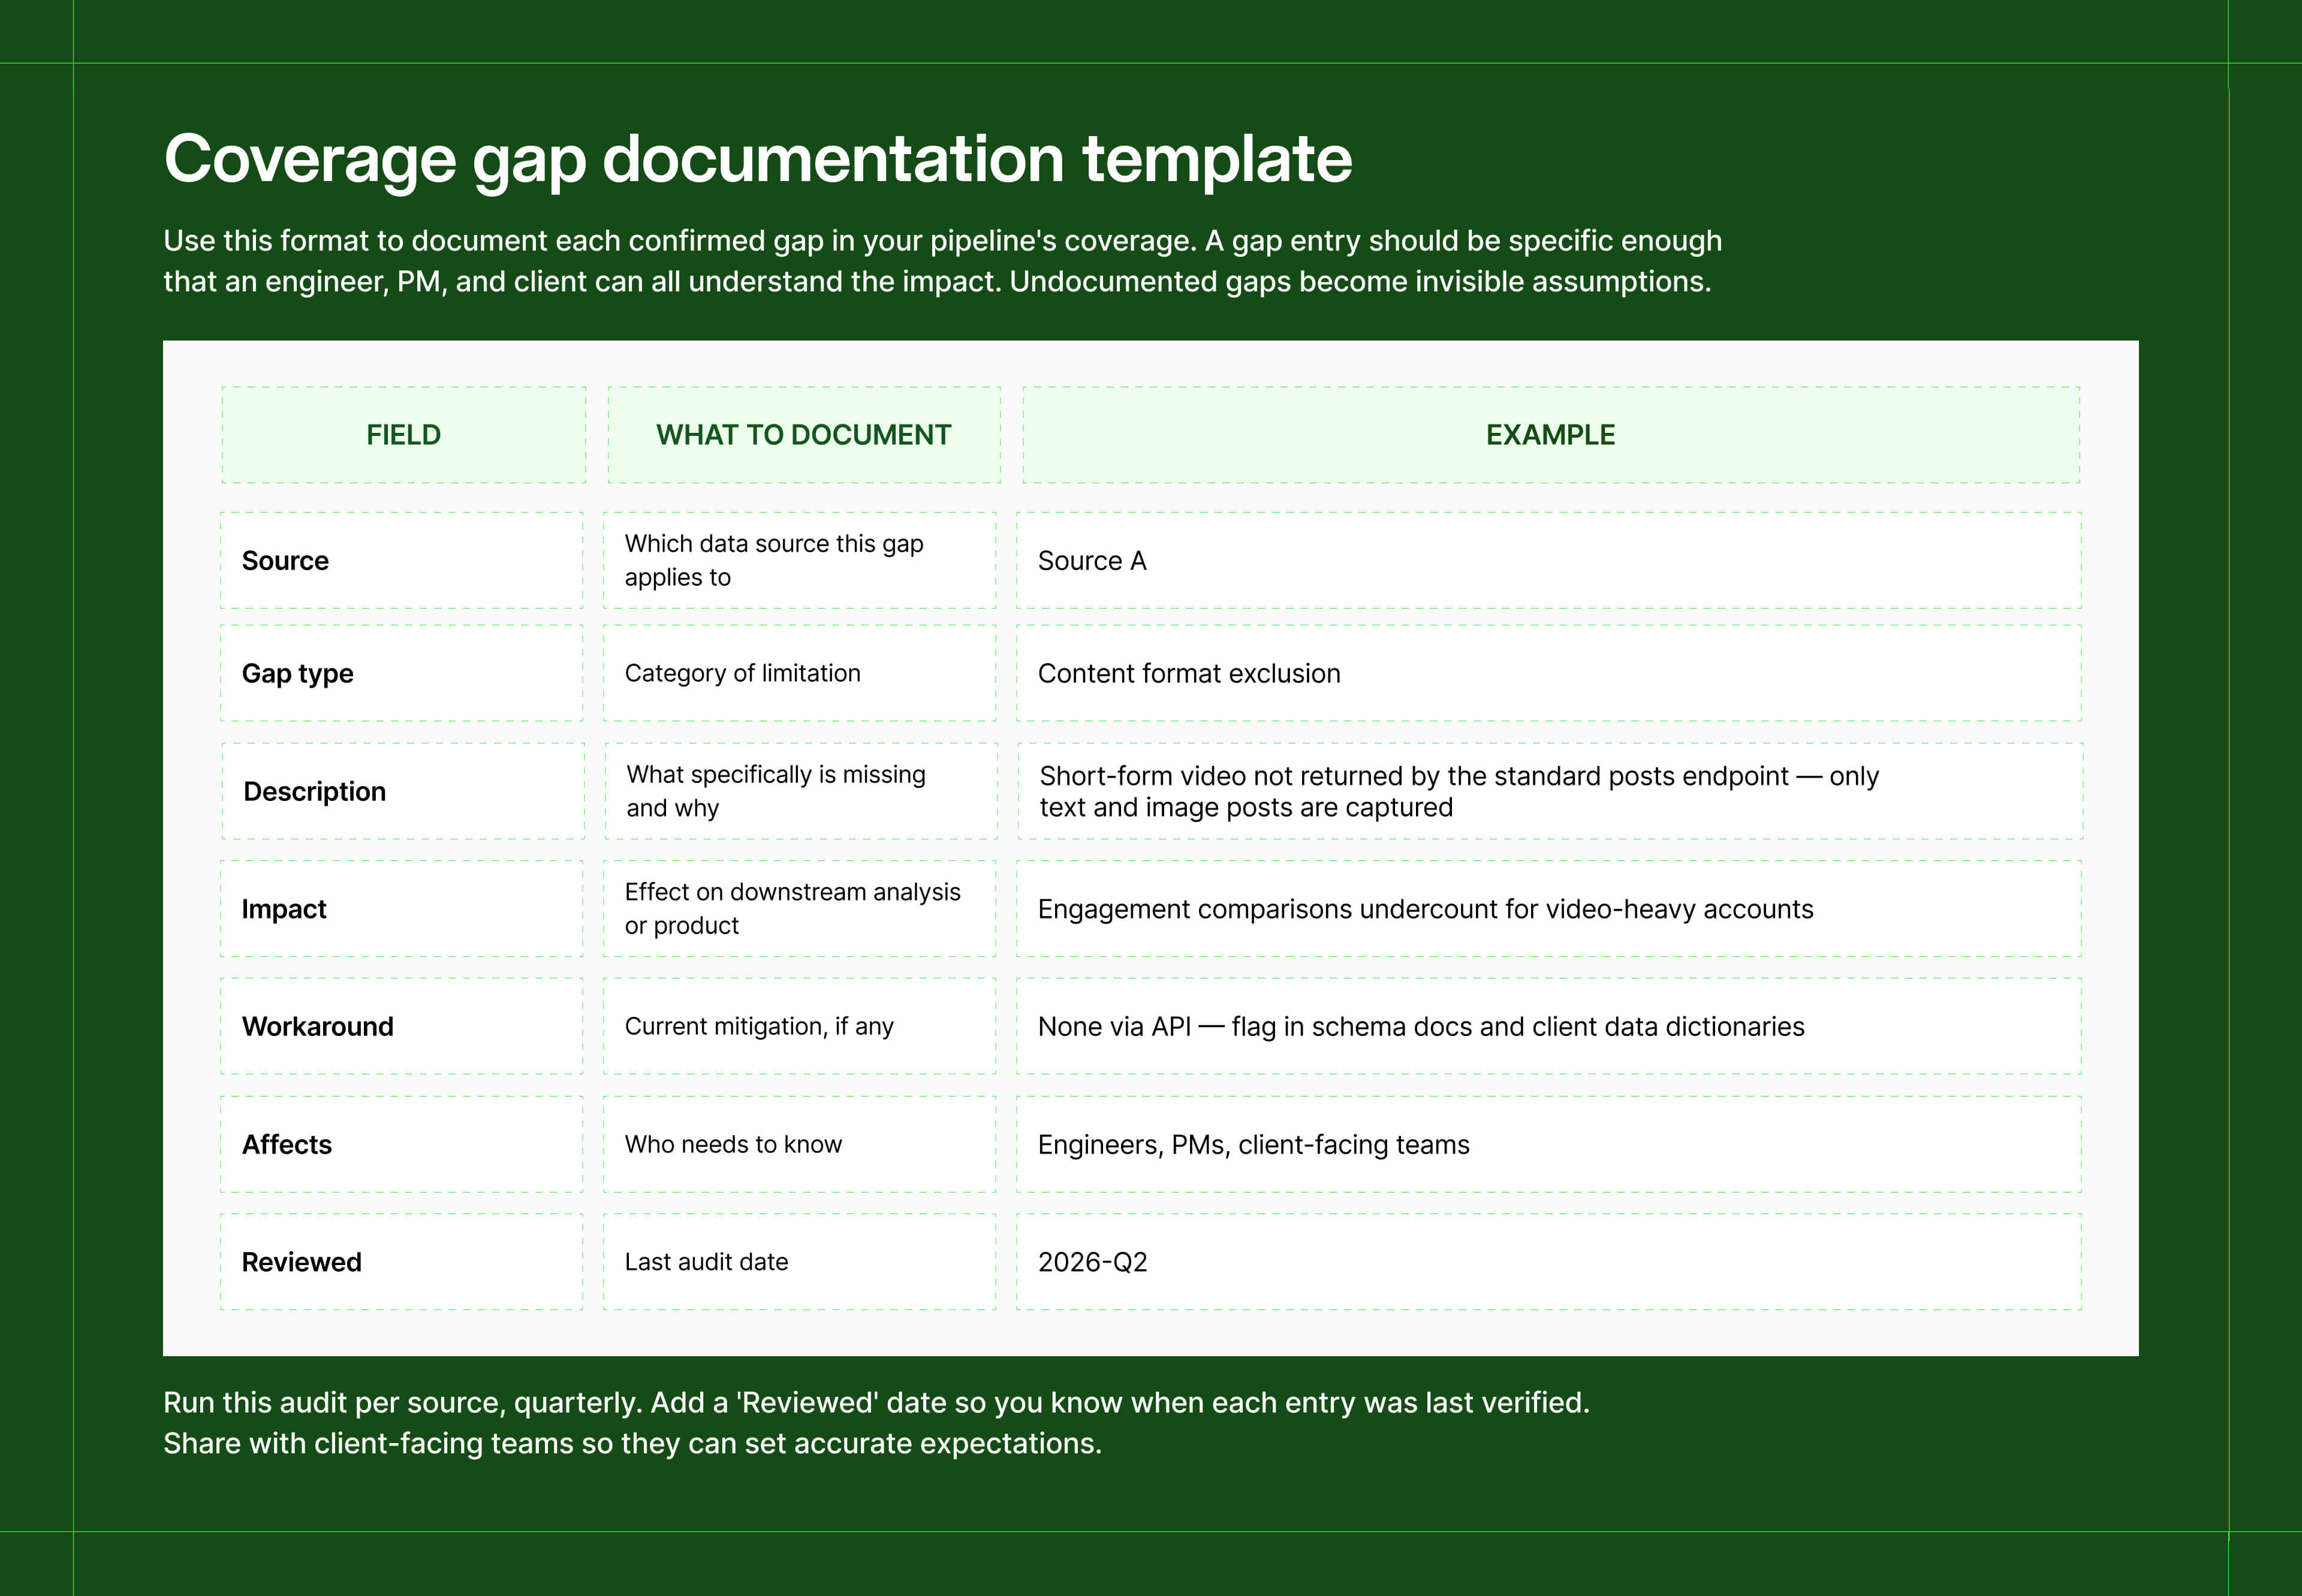
Instead of an undocumented assumption, the gap becomes a known constraint that engineers, product managers, and clients can all reference.
Step 3: Run the audit on a cadence
Coverage gaps shift as APIs evolve, rate limits tighten, and new content formats emerge. Quarterly is a reasonable minimum for high-volume pipelines.
✓ What this forces: A real conversation about acceptable quality thresholds. What percentage of missing data from a given source is tolerable before it needs to be disclosed? These questions get significantly harder to answer the longer they go unasked, and much more expensive when they surface during a client escalation.
Where to start
Not all six fixes carry the same urgency. Fixes 1 and 2 are the fastest to ship and address the most acute failure modes – if you can only do two things this week, start there.
The underlying issue
Every one of these fixes is a response to the same gap: the difference between a pipeline that runs and a pipeline you can trust.
Here's what to take away:
- Deduplication downstream means your metrics are as reliable as your cleanup schedule. Move it to ingestion.
- A try/catch with a fixed sleep isn't retry logic. Distinguish transient from permanent failures, and make sure nothing disappears without a record.
- Schema drift is silent until it isn't. By the time a field rename surfaces in a dashboard, the bad data is already weeks deep.
- Cross-source engagement numbers in the same column don't mean the same thing. Normalise at the transformation layer or the comparisons are meaningless.
- If clients are telling you about pipeline failures, your monitoring is behind where it needs to be.
- Every pipeline has coverage gaps. The ones that aren't documented are the ones that cause the most damage.
💡 If you're building on top of social data and tired of maintaining the infrastructure underneath it, Datashake gives you a single normalised API across sources – cleaned, deduplicated, and consistently structured out of the box. See how it works.
For more on where social data pipelines lose coverage before this layer applies:
→ Why your social media data is incomplete
→ Should you build vs buy your social data pipeline
Frequently asked questions
What is schema drift in a data pipeline?
Schema drift is when the structure of incoming data changes – a field gets renamed, a data type shifts, or a new required field appears – without your pipeline being updated to handle it. It often causes silent failures: the pipeline keeps running but writes nulls, drops fields, or produces incorrect outputs downstream.
What is a dead letter queue (DLQ)?
A dead letter queue is a holding area for messages or requests that have failed all retry attempts and can't be processed. It preserves the original payload so you can investigate failures, fix the root cause, and replay them without losing data. Without a DLQ, permanently failed requests disappear without trace.
What is watermark-based incremental loading?
A strategy for only extracting new or updated records on each pipeline run, rather than reloading the full dataset every time. You store the timestamp or ID of the last processed record as a watermark and use it as the starting point for your next extraction. It reduces processing overhead, cuts duplication risk, and makes your pipeline idempotent.
What is exponential backoff in API retry logic?
A retry strategy where the wait time between each retry attempt increases exponentially – 1 second, then 2, then 4, then 8 – up to a maximum cap. Combined with jitter (a small random offset), it prevents multiple workers from retrying simultaneously and overwhelming an already-struggling API.
Why do cross-platform social media metrics differ?
Because each source defines and measures metrics independently. Engagement might include different interaction types. Reach is measured at different scopes. Video views use different playback thresholds. The problem arises when unnormalised numbers from different sources are treated as comparable in the same analysis.


More insights you might like

%20thumbnail.jpg)