Why The Complexity of Data Collection is Killing Your Business
Data collection looks simple, until you're doing it at scale.
Then it looks like maintenance tickets, broken connectors, compliance questions nobody owns, and a product roadmap that keeps slipping.
This post is about why that happens, what it actually costs, and what to do about it. ⬇️
TL;DR – what this post covers
- Why social media API access has become genuinely expensive before you write a line of code
- What data pipeline maintenance actually costs your engineering team in time and velocity
- The schema normalisation problem that most build estimates miss entirely
- How to model the true three-year cost of building in-house vs. buying
- Why coverage gaps are the silent problem that compounds after everything else is solved
- When building is still the right call, and the questions that determine which side you're on
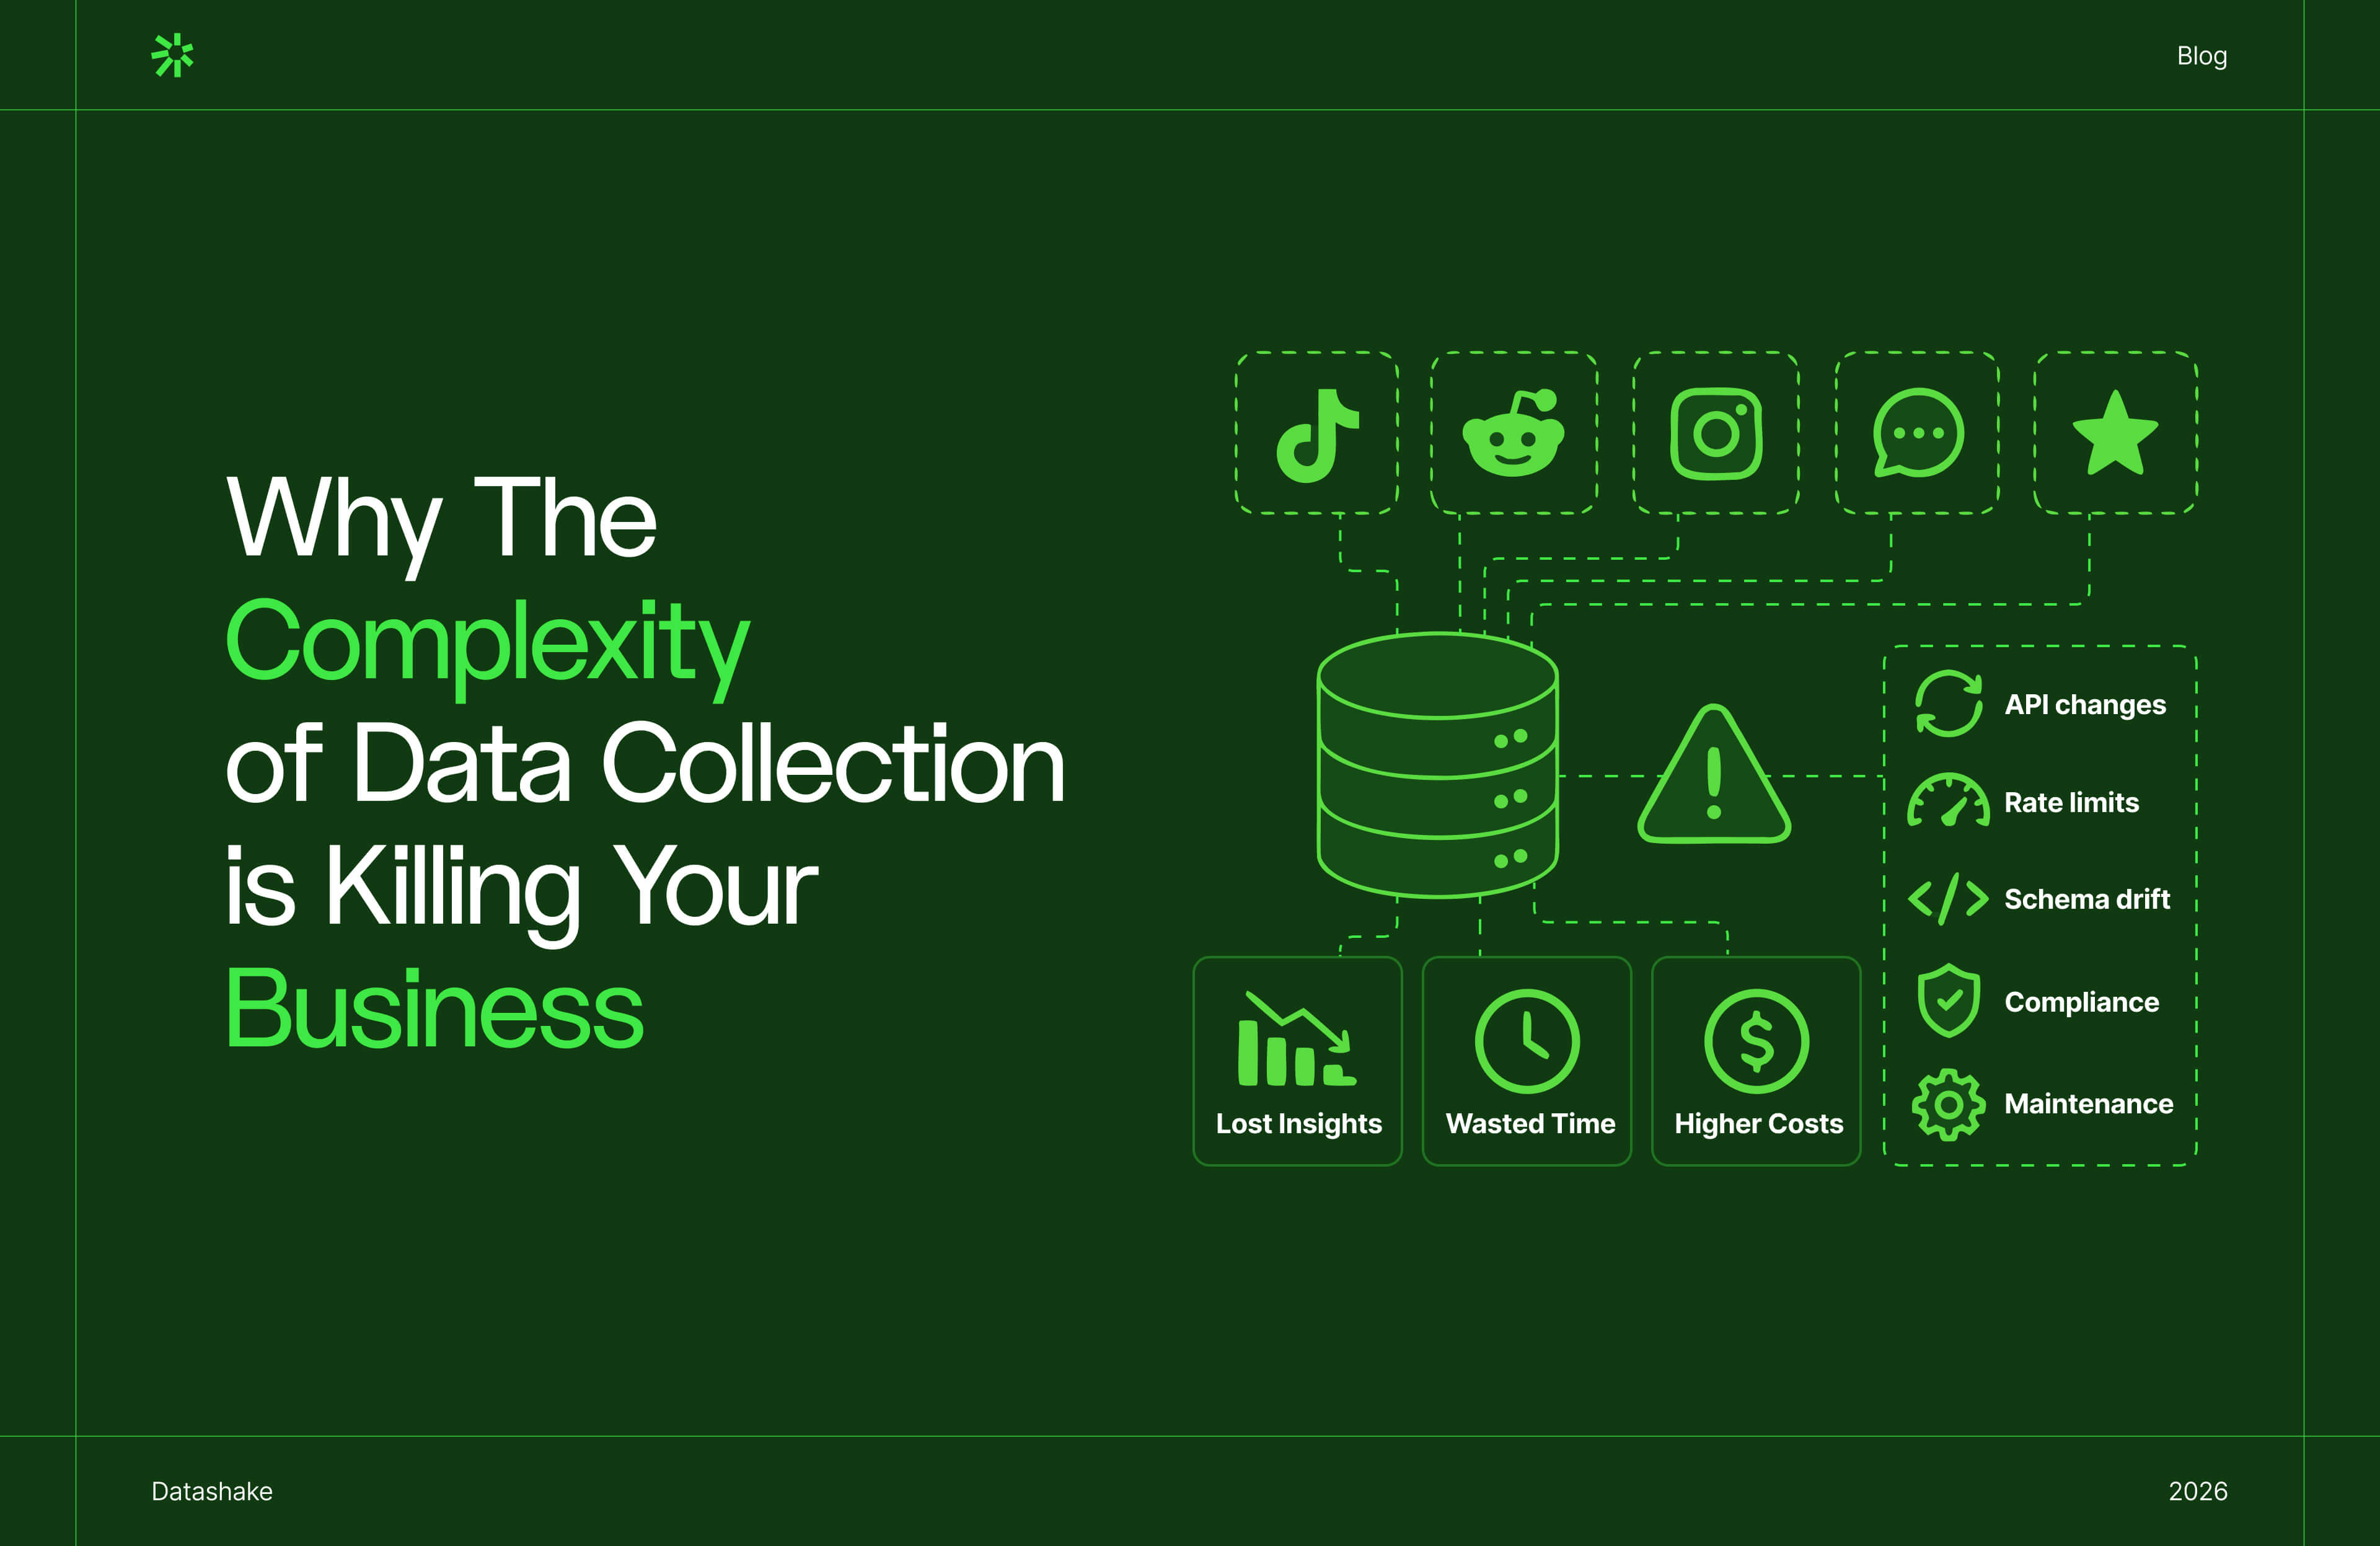
Why is collecting data complex for SaaS teams?
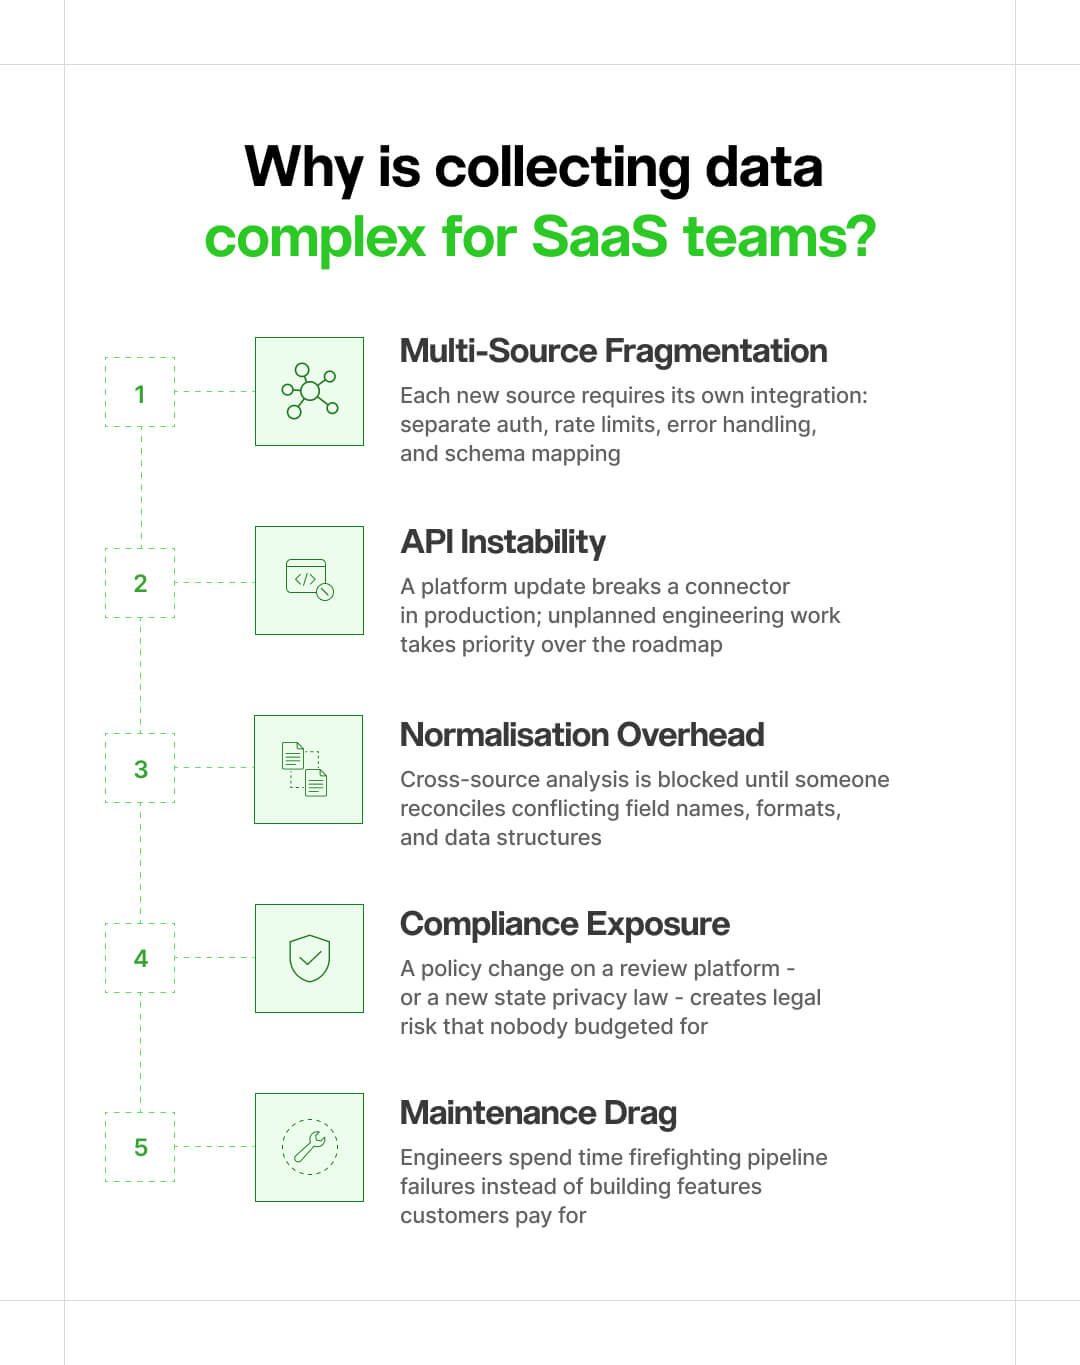
Data collection complexity is the cumulative technical, operational, and legal burden of gathering structured data from multiple external sources – social platforms, review sites, forums, app stores – at a quality and scale that's actually usable in a product or analytics workflow.
It’s essentially five problems that interact with each other:
1. Multi-source fragmentation
Every platform operates differently. With different authentication models, rate limits, schemas, and update cycles. Instagram doesn't talk to Reddit. Reddit doesn't talk to Trustpilot.
There's no universal standard, you have to bridge each source individually, then keep those bridges intact as platforms change.
2. API instability
Platforms treat their data as a commercial asset, and access terms reflect that.
Endpoints get deprecated. Pricing changes overnight. Free tiers get cut. What worked six months ago may require a full rebuild today, and platforms rarely give much warning when they make these calls.
3. Normalisation overhead
Raw data from different sources isn't comparable. A "rating" on Google is a float out of 5. On G2 it's a percentage. On an app store it's a star count with a volume figure.
Making these consistent (across sources and time, at scale) is a significant engineering problem that tends to be badly underestimated at the start of a build.
4. Compliance exposure
Collecting public data is not automatically legal or compliant. GDPR, CCPA, platform terms of service, and an expanding set of US state privacy laws all have implications for how data is collected, stored, and used. These requirements change, and someone has to track them.
5. Maintenance drag
Everything above is ongoing, not one-time. Connectors break. Platforms change their schemas. APIs get versioned out. The pipeline you built in Q1 needs attention in Q3, and again in Q1 of the following year. That work never stops.
Problem
What it looks like day-to-day
Multi-source fragmentation
Each new source requires its own integration: separate auth, rate limits, error handling, and schema mapping
API instability
A platform update breaks a connector in production; unplanned engineering work takes priority over the roadmap
Normalisation overhead
Cross-source analysis is blocked until someone reconciles conflicting field names, formats, and data structures
Compliance exposure
A policy change on a review platform – or a new state privacy law – creates legal risk that nobody budgeted for
Maintenance drag
Engineers spend time firefighting pipeline failures instead of building features customers pay for
💡Want to go deeper on this? We broke down the build vs. buy decision specifically for social media data pipelines – including how to factor API access costs into the comparison from the start. Should You Build or Buy Your Social Media Data Pipeline? →
How social media API access has changed, and what it's costing you
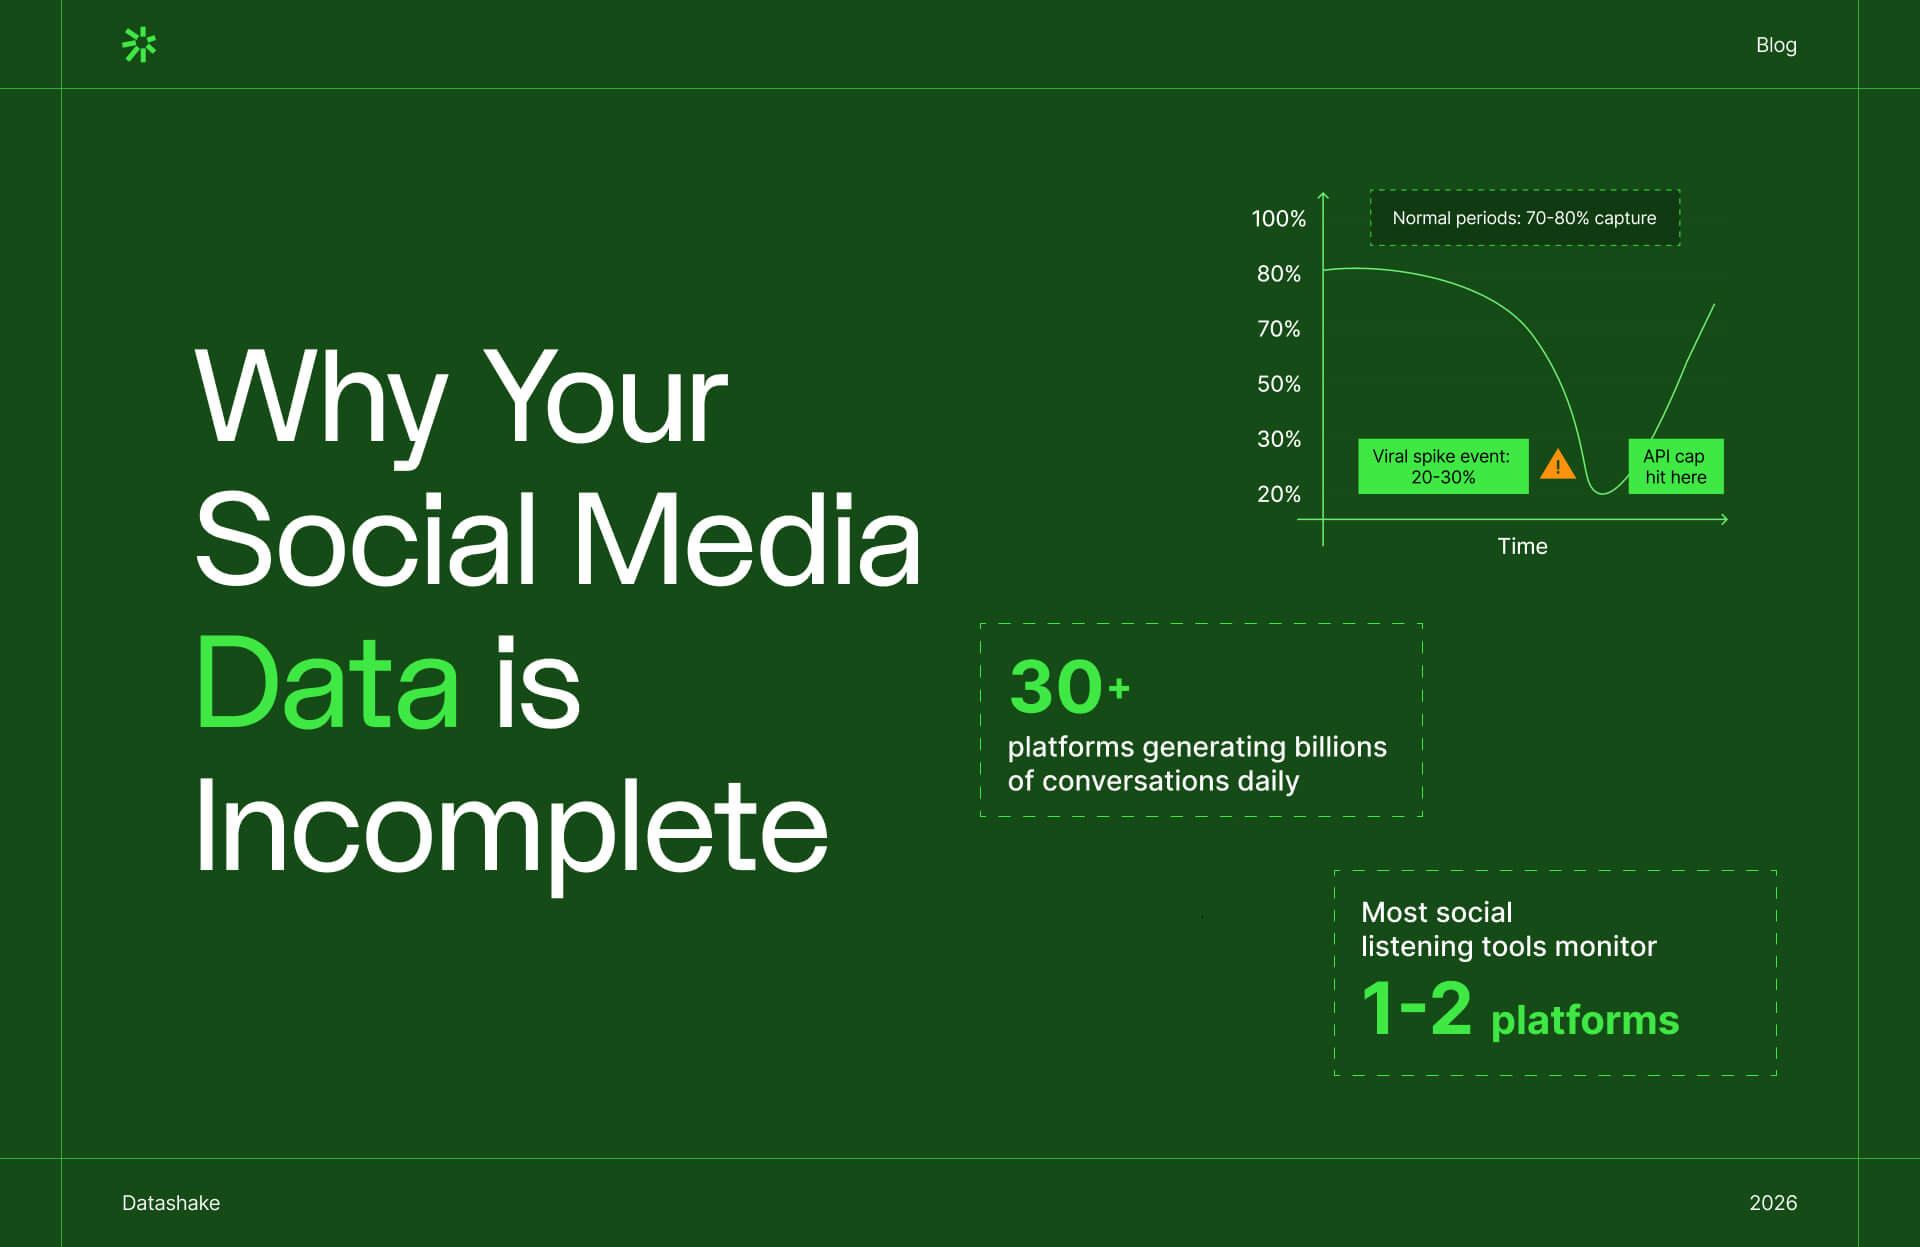
A social media API (Application Programming Interface) is the official channel through which developers request data from a platform posts, comments, reviews, engagement metrics, user activity. Until around 2022, most major platforms offered generous free access tiers as a way to encourage developer ecosystems.
That model has been largely dismantled. Between 2023 and 2026, every major platform moved toward metered, commercially-priced API access. As a result, data that was effectively free to access three years ago now carries significant direct costs, approval processes, and access restrictions that didn't previously exist.
Access that used to be free isn't anymore
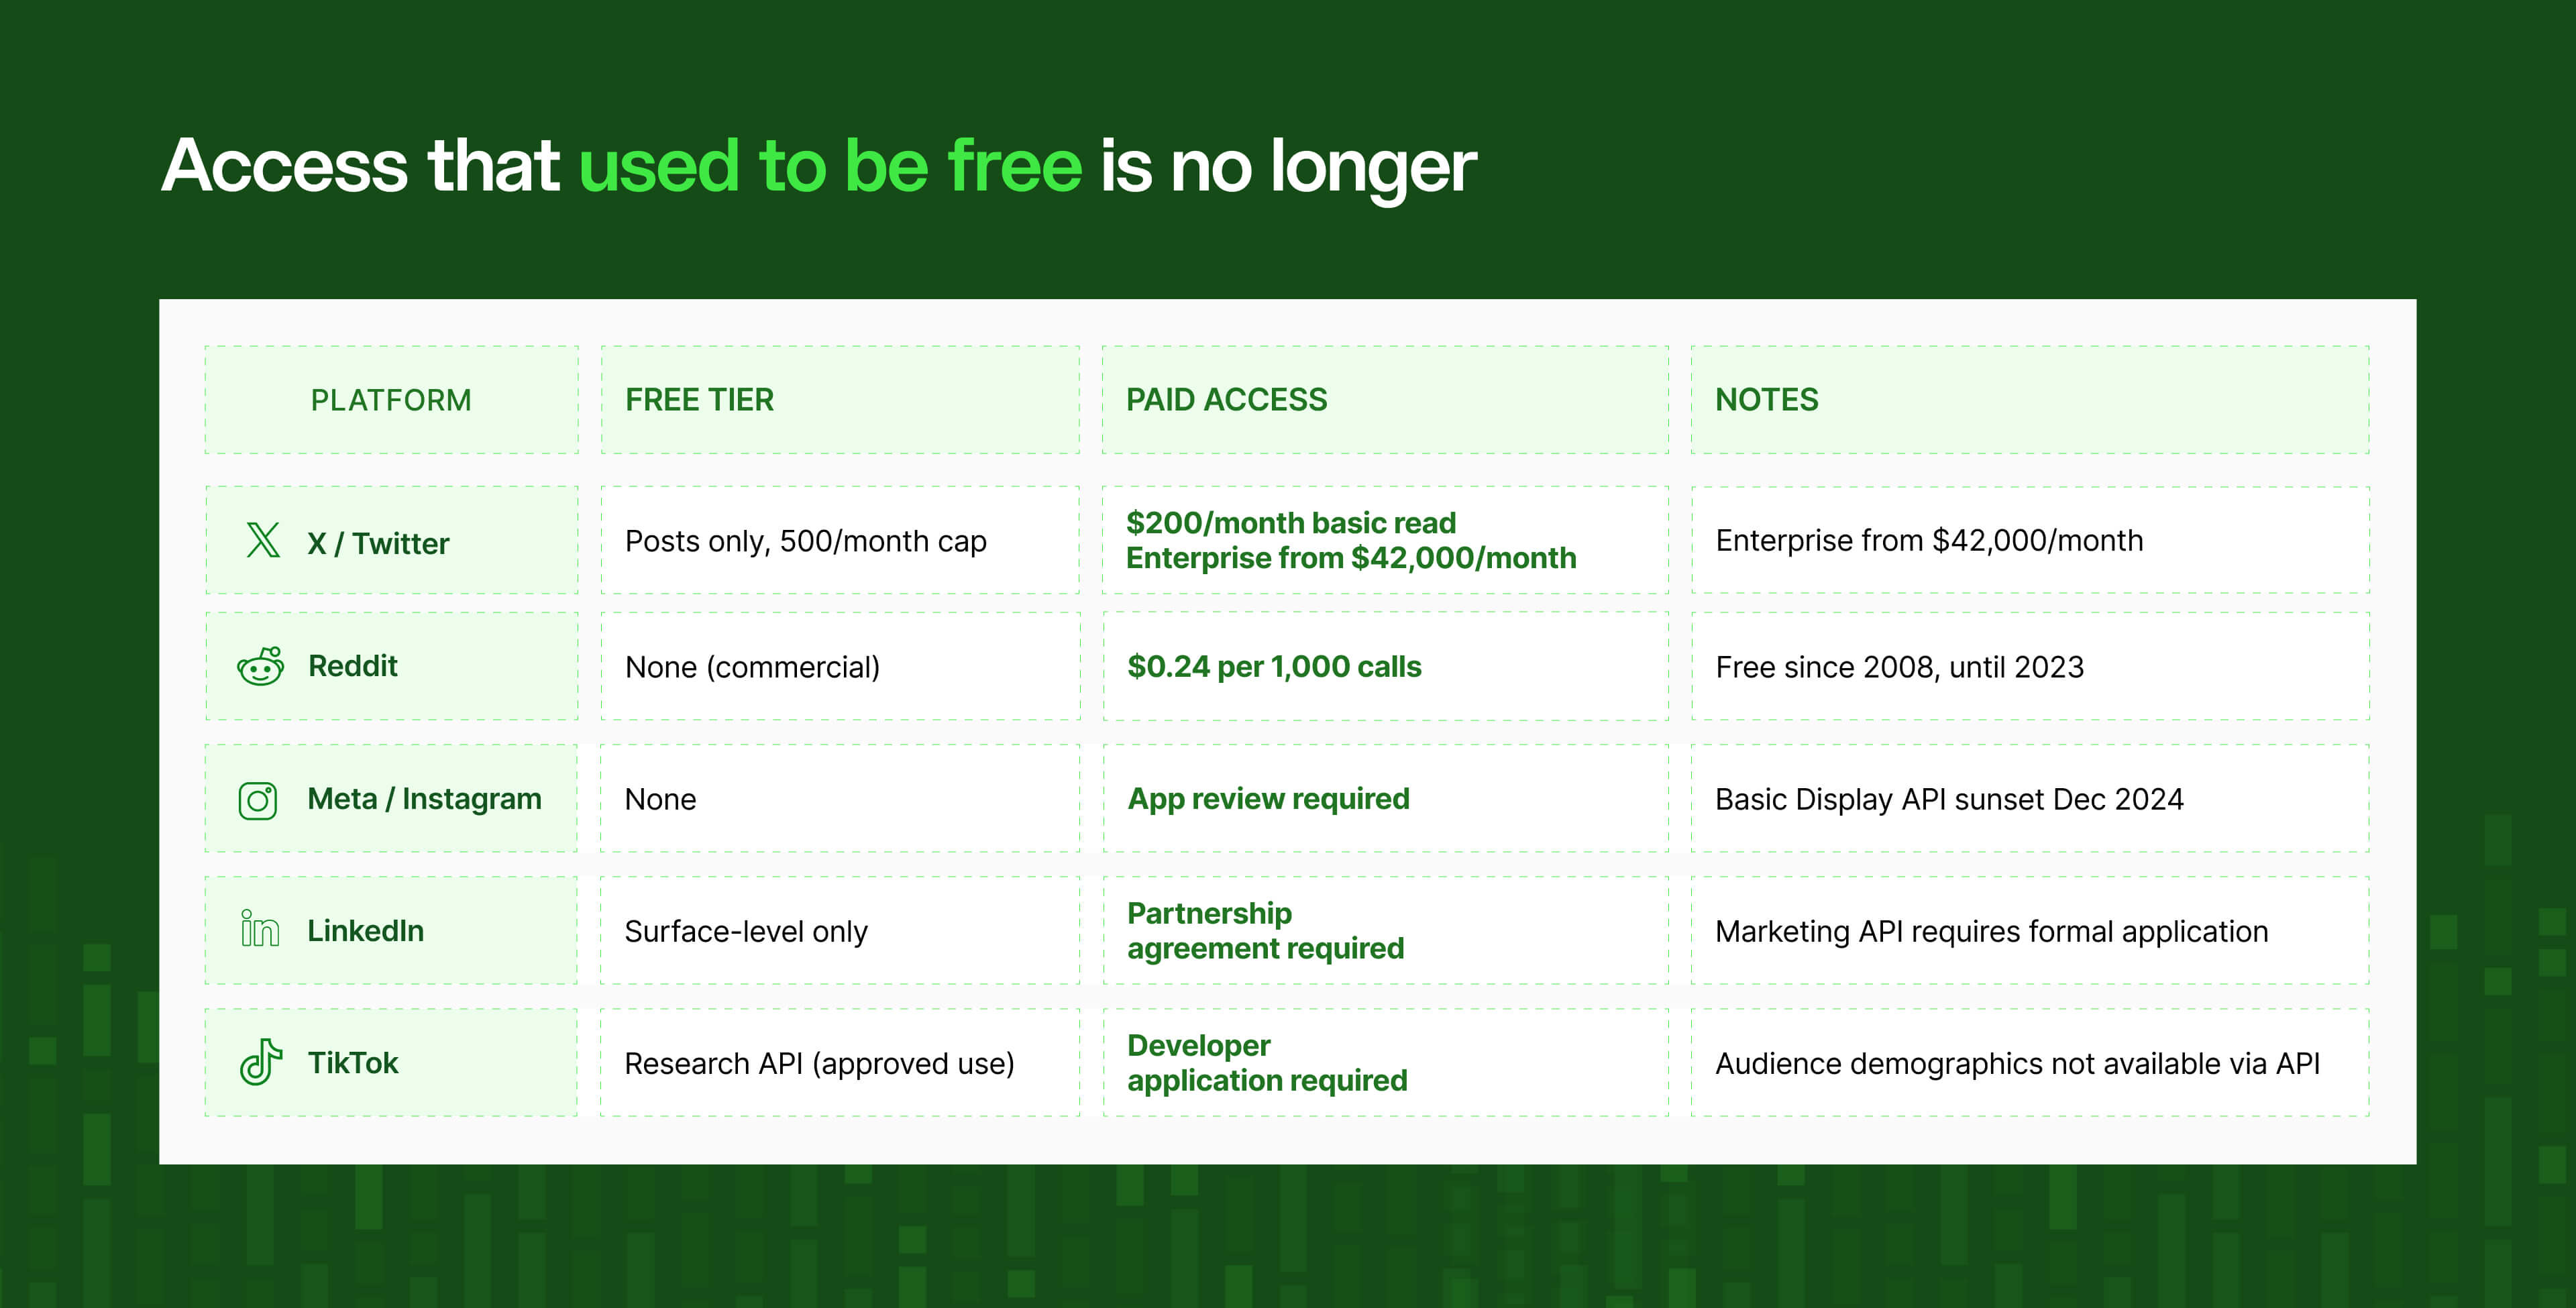
Five years ago, the cost barrier to building a social data collection pipeline was mostly time. APIs were open, and rate limits were generous. A reasonably capable engineering team could get something working without significant upfront spend.
That's no longer the case.
The economics shifted between 2023 and 2024, when platforms began treating data access as a revenue line rather than a developer benefit.
- X/Twitter cut its free tier to almost nothing and introduced pay-per-use pricing, moving from generous free access to a model where basic read access starts at $200/month and enterprise access starts at $42,000/month – with the free tier capped at 500 posts per month, making it useless for any production use
- Reddit ended free API access for commercial use in July 2023, after the service had been free since 2008 – triggering the largest developer and community protest in the platform's history, with over 8,000 subreddits going dark in protest
- Meta deprecated personal-account access on Instagram on December 4, 2024, shutting down the Basic Display API with no free replacement – every third-party app relying on personal Instagram account access stopped working overnight
- LinkedIn moved anything useful behind a formal partner application process, with the Partner tier (required for any commercial-scale integration) subject to application review, partnership agreement, and a rejection rate that makes approval unrealistic for most teams
So now, before your team writes a single line of pipeline code, you're already making purchasing decisions, not just technical ones. Access costs are now a real budget item, approval timelines can run into weeks, and the access tier you can actually get approved for may not cover the data volume or depth your product needs.
Every platform speaks a different language
Even once you have access, you're dealing with fragmentation at the integration layer.
Each social media API carries its own authentication flows, data structures, rate limits, and deprecation timelines – and the complexity compounds with every platform you add.
Building native integrations for just 14 platforms independently takes six or more months of engineering time. ⬇️
- Separate OAuth flows for each
- Different media handling
- Different rate limit buckets
- Different error codes and backoff logic
- Different schemas for what is, ultimately, the same category of data – a post, a comment, a review.
The engineering cost of maintaining multiple direct integrations exceeds the cost of a well-designed unified layer by a considerable margin. And that's before you factor in what happens when platforms change things.
6 social media API deprecations that broke production integrations
API deprecation is a regular occurrence, and it hits without warning:
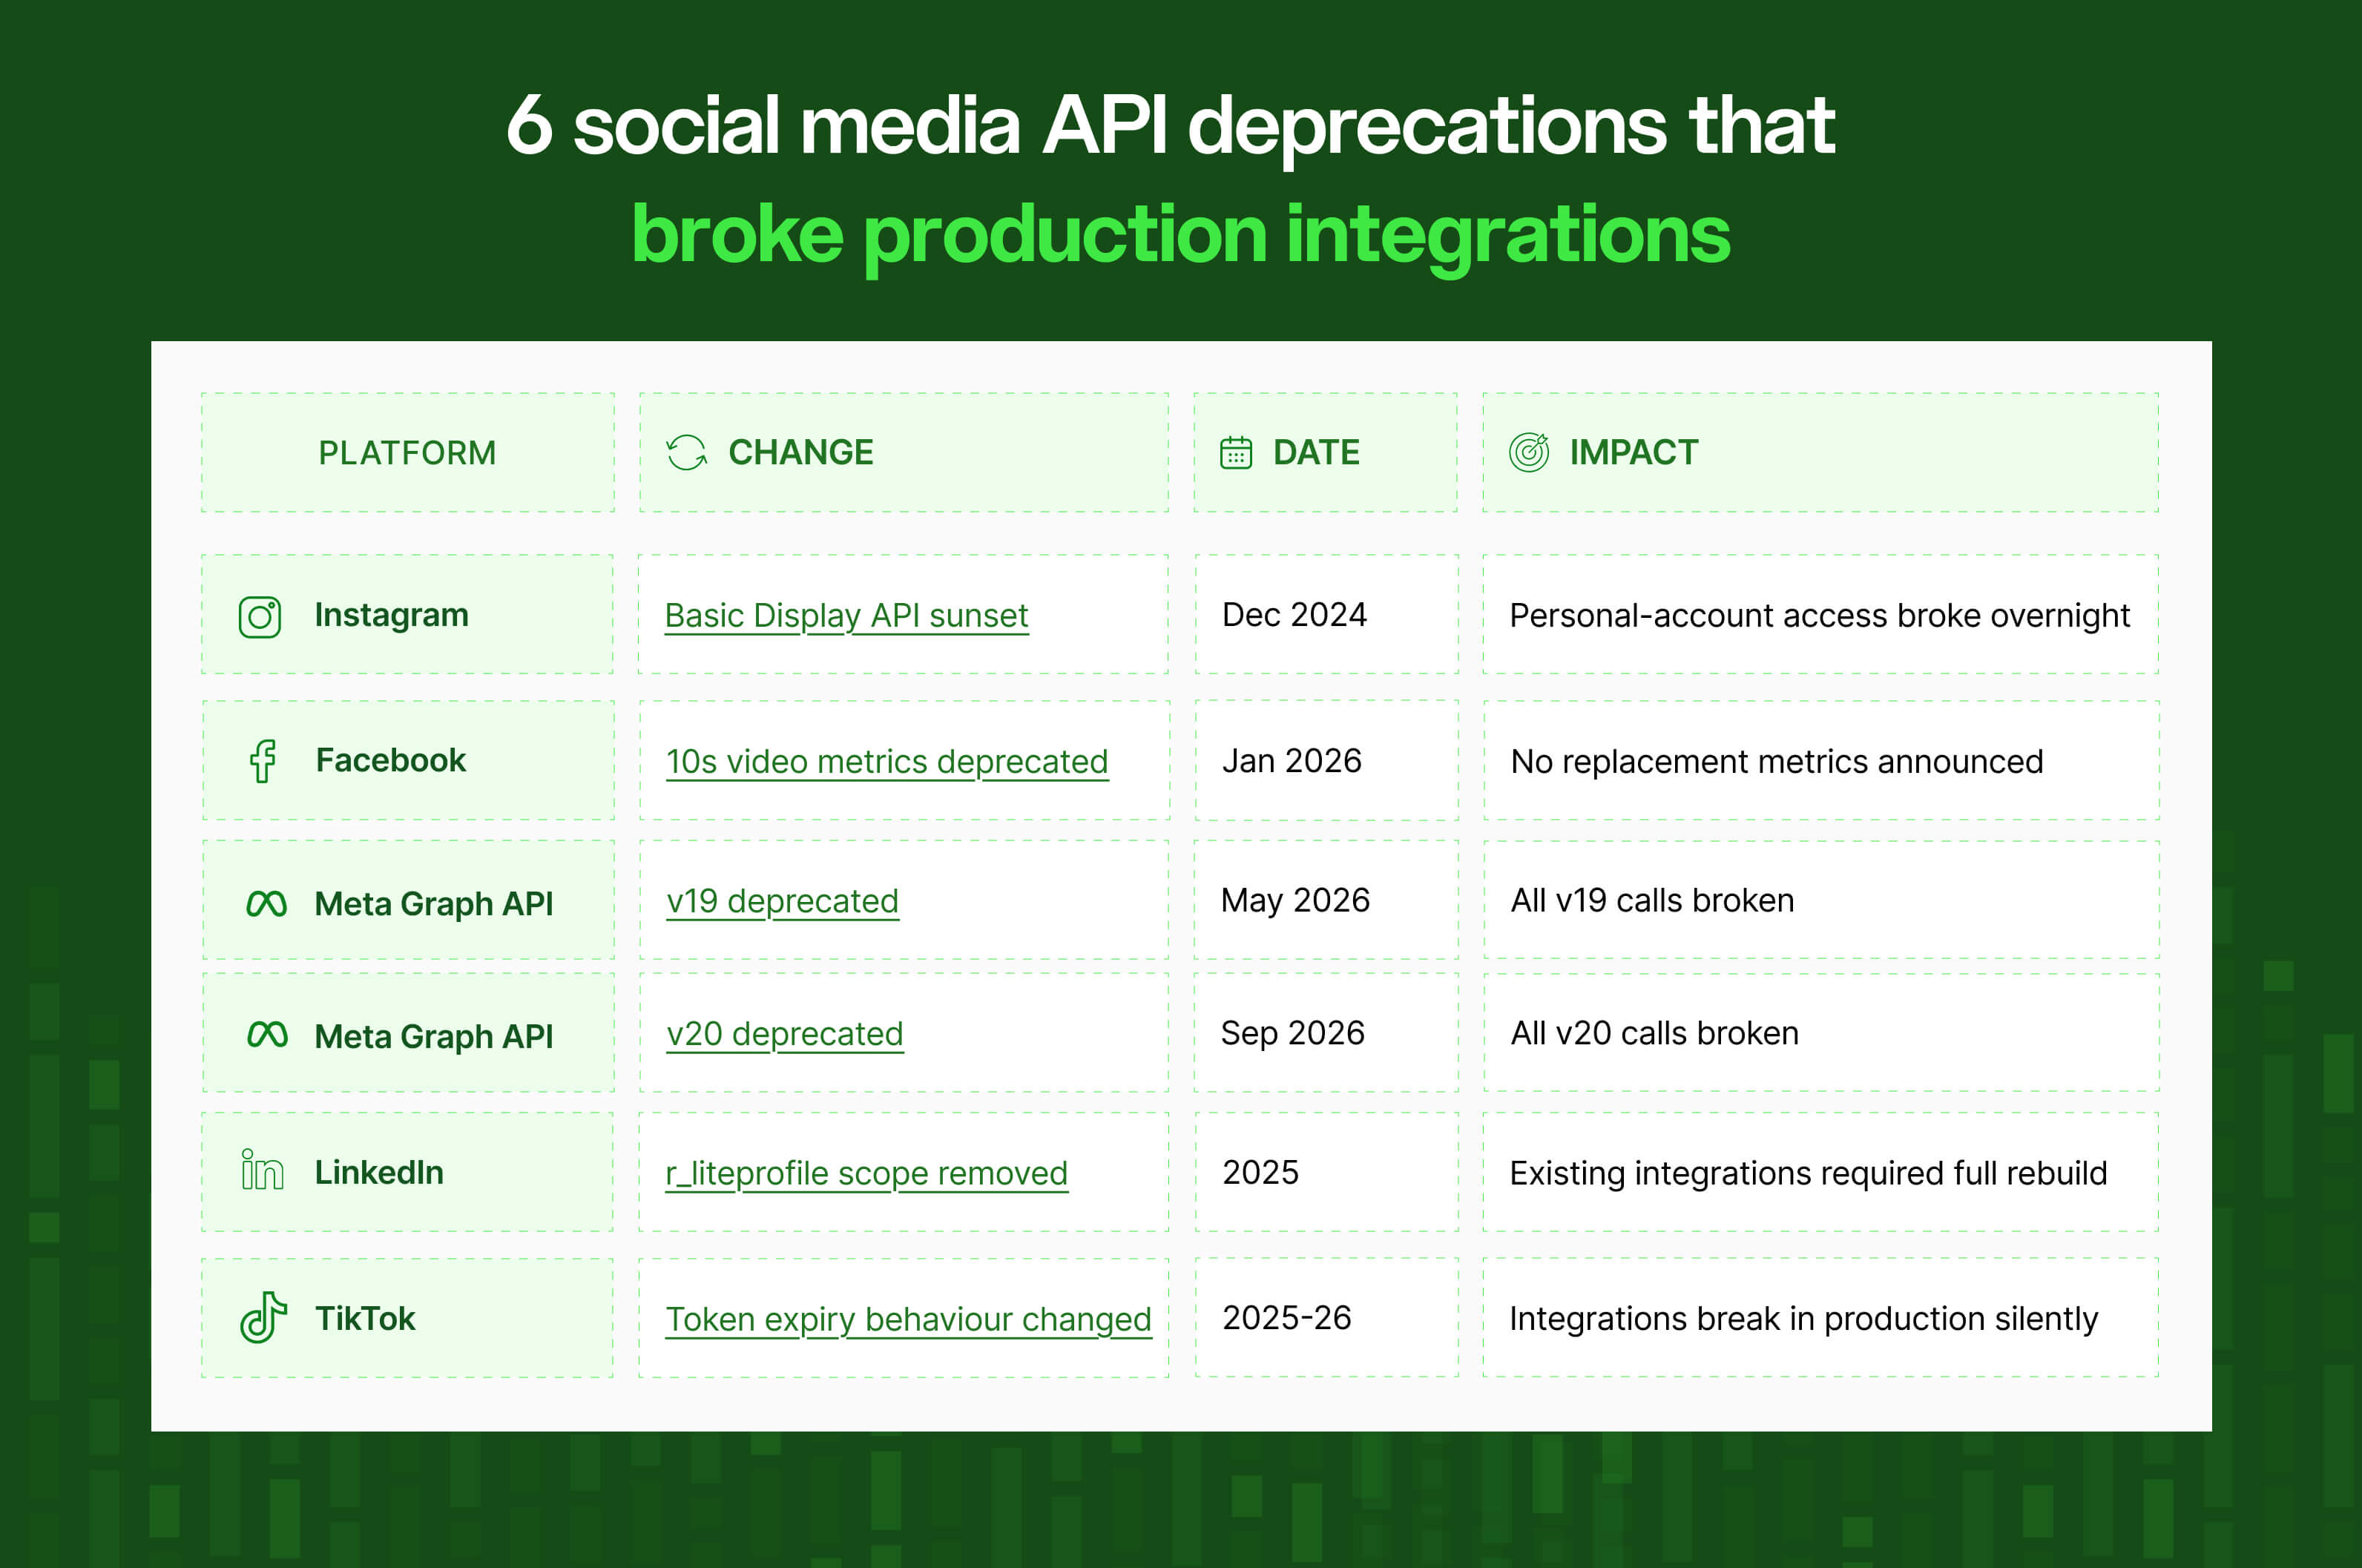
Every one of those incidents is unplanned engineering work landing on a team that had other things to do.
👀 What this means for your team: If you're collecting from five or more sources, expect to spend engineering time on unplanned API maintenance multiple times per year. Budget for it explicitly, or decide not to own that problem.
Where your engineering time goes when you build your own data pipeline
Data pipeline maintenance is the ongoing engineering work required to keep data collection infrastructure functioning as external conditions change. Unlike the initial build, it has no defined scope and no end date.
For teams collecting from multiple sources, it typically means: responding to API deprecations; updating authentication logic when platforms change token behaviour; rebuilding connectors after schema updates; debugging silent failures where data stops flowing without an error; and reconciling normalisation logic when a source changes its structure.
The maintenance burden
💬 What percentage of your engineering team's time is going to data collection and maintenance versus building product?
If you've built your own pipelines, the answer is often higher than you'd expect.
- It’s very common for data engineers to be pinged in the middle of the night to fix pipelines that never used to fail.
- Alert fatigue sets in as teams spend more time re-running broken pipelines instead of building new ones.
- Downstream teams – product managers, data analysts, intelligence teams – get blocked waiting for data that isn't arriving.
Why technical debt compounds in data infrastructure
💡 Key takeaway: Data engineers spend approximately 40% of their time on data quality issues, not building. For teams maintaining their own social data pipelines, that overhead is real, ongoing, and competes directly with product development.
Technical debt in data infrastructure follows the same logic as financial debt: every shortcut you take now costs more to fix later, and the interest compounds.
It starts small ⬇️
- A connector gets patched rather than properly rebuilt because the sprint is ending
- A normalisation edge case gets hardcoded rather than handled systematically
- A rate limit workaround gets shipped because it works for now.
None of these decisions feel significant at the time. Each one adds a small layer of fragility to the system.
Months later, those layers have accumulated. The pipeline works, but nobody is quite sure why. What started as temporary Python scripts running on cron jobs has become mission-critical infrastructure that nobody fully understands.
The engineer who built it has moved on. The documentation is incomplete. And when something breaks (which it inevitably will), fixing it takes significantly longer than it should, because the person debugging it is working without a map.
➡️ Each piece of deferred maintenance makes the next incident harder to resolve, the next change more risky to make, and the next engineer slower to get up to speed. The system becomes progressively less transparent and more expensive to operate, even if it technically keeps running.
McKinsey Digital estimates that technical debt represents 20–40% of an organisation's total technology estate value before depreciation. Around 30% of CIOs report that more than 20% of their technical budget gets consumed by fixing existing technical debt. Money budgeted for growth ends up paying the interest on past shortcuts.
💡 Want to go deeper on this? If your team is already dealing with pipeline maintenance overhead, this post covers the most common failure modes, and what to do about them. How to Improve Your Social Media Data Pipeline →
On the flip side, companies that treat data as a product – with clear ownership, proper infrastructure, and ongoing investment – significantly reduce the time it takes to implement new use cases and lower total cost of ownership over time. So the choice isn't just to build vs. buy. It's whether you're building something you'll have to pay an ever-increasing interest rate on, or investing in infrastructure you can actually build on top of.
👀 What this means for your team: Run a quick audit. Count the open tickets related to data pipeline maintenance. Count the hours your engineers spent on connector issues last quarter. Now compare that number against the features on your roadmap that slipped in the same period. That difference is your technical debt interest payment.
Data schema normalisation: why collecting from multiple sources is harder than it looks
💡 Key takeaway: 70% of pipeline complexity sits in transformation and schema management, not in the integrations themselves. This is the part of the build that almost always gets underestimated, and the part that degrades fastest when the engineer who built it moves on.
What happens when every data source uses a different schema
Let’s say you've built connectors to five review platforms and three social channels. Each one returns data in its own structure: different field names, rating formats, timestamp conventions, and metadata schemas.
Now your product manager wants a cross-platform analysis. Or a customer wants unified search across sources. Or your data team needs to run a competitive intelligence report.
Before any of that can happen, someone has to normalise the data.
What is data schema normalisation, and why does it matter?
Schema normalisation is the work of taking data from multiple sources that each use their own structure, field names, formats, and conventions, and making it consistent enough to actually use together. It sounds like a data cleaning task. In practice, it's one of the most time-consuming and fragile parts of any multi-source data pipeline.
What a normalisation problem looks like in practice
Take a single field: a review rating. ⬇️
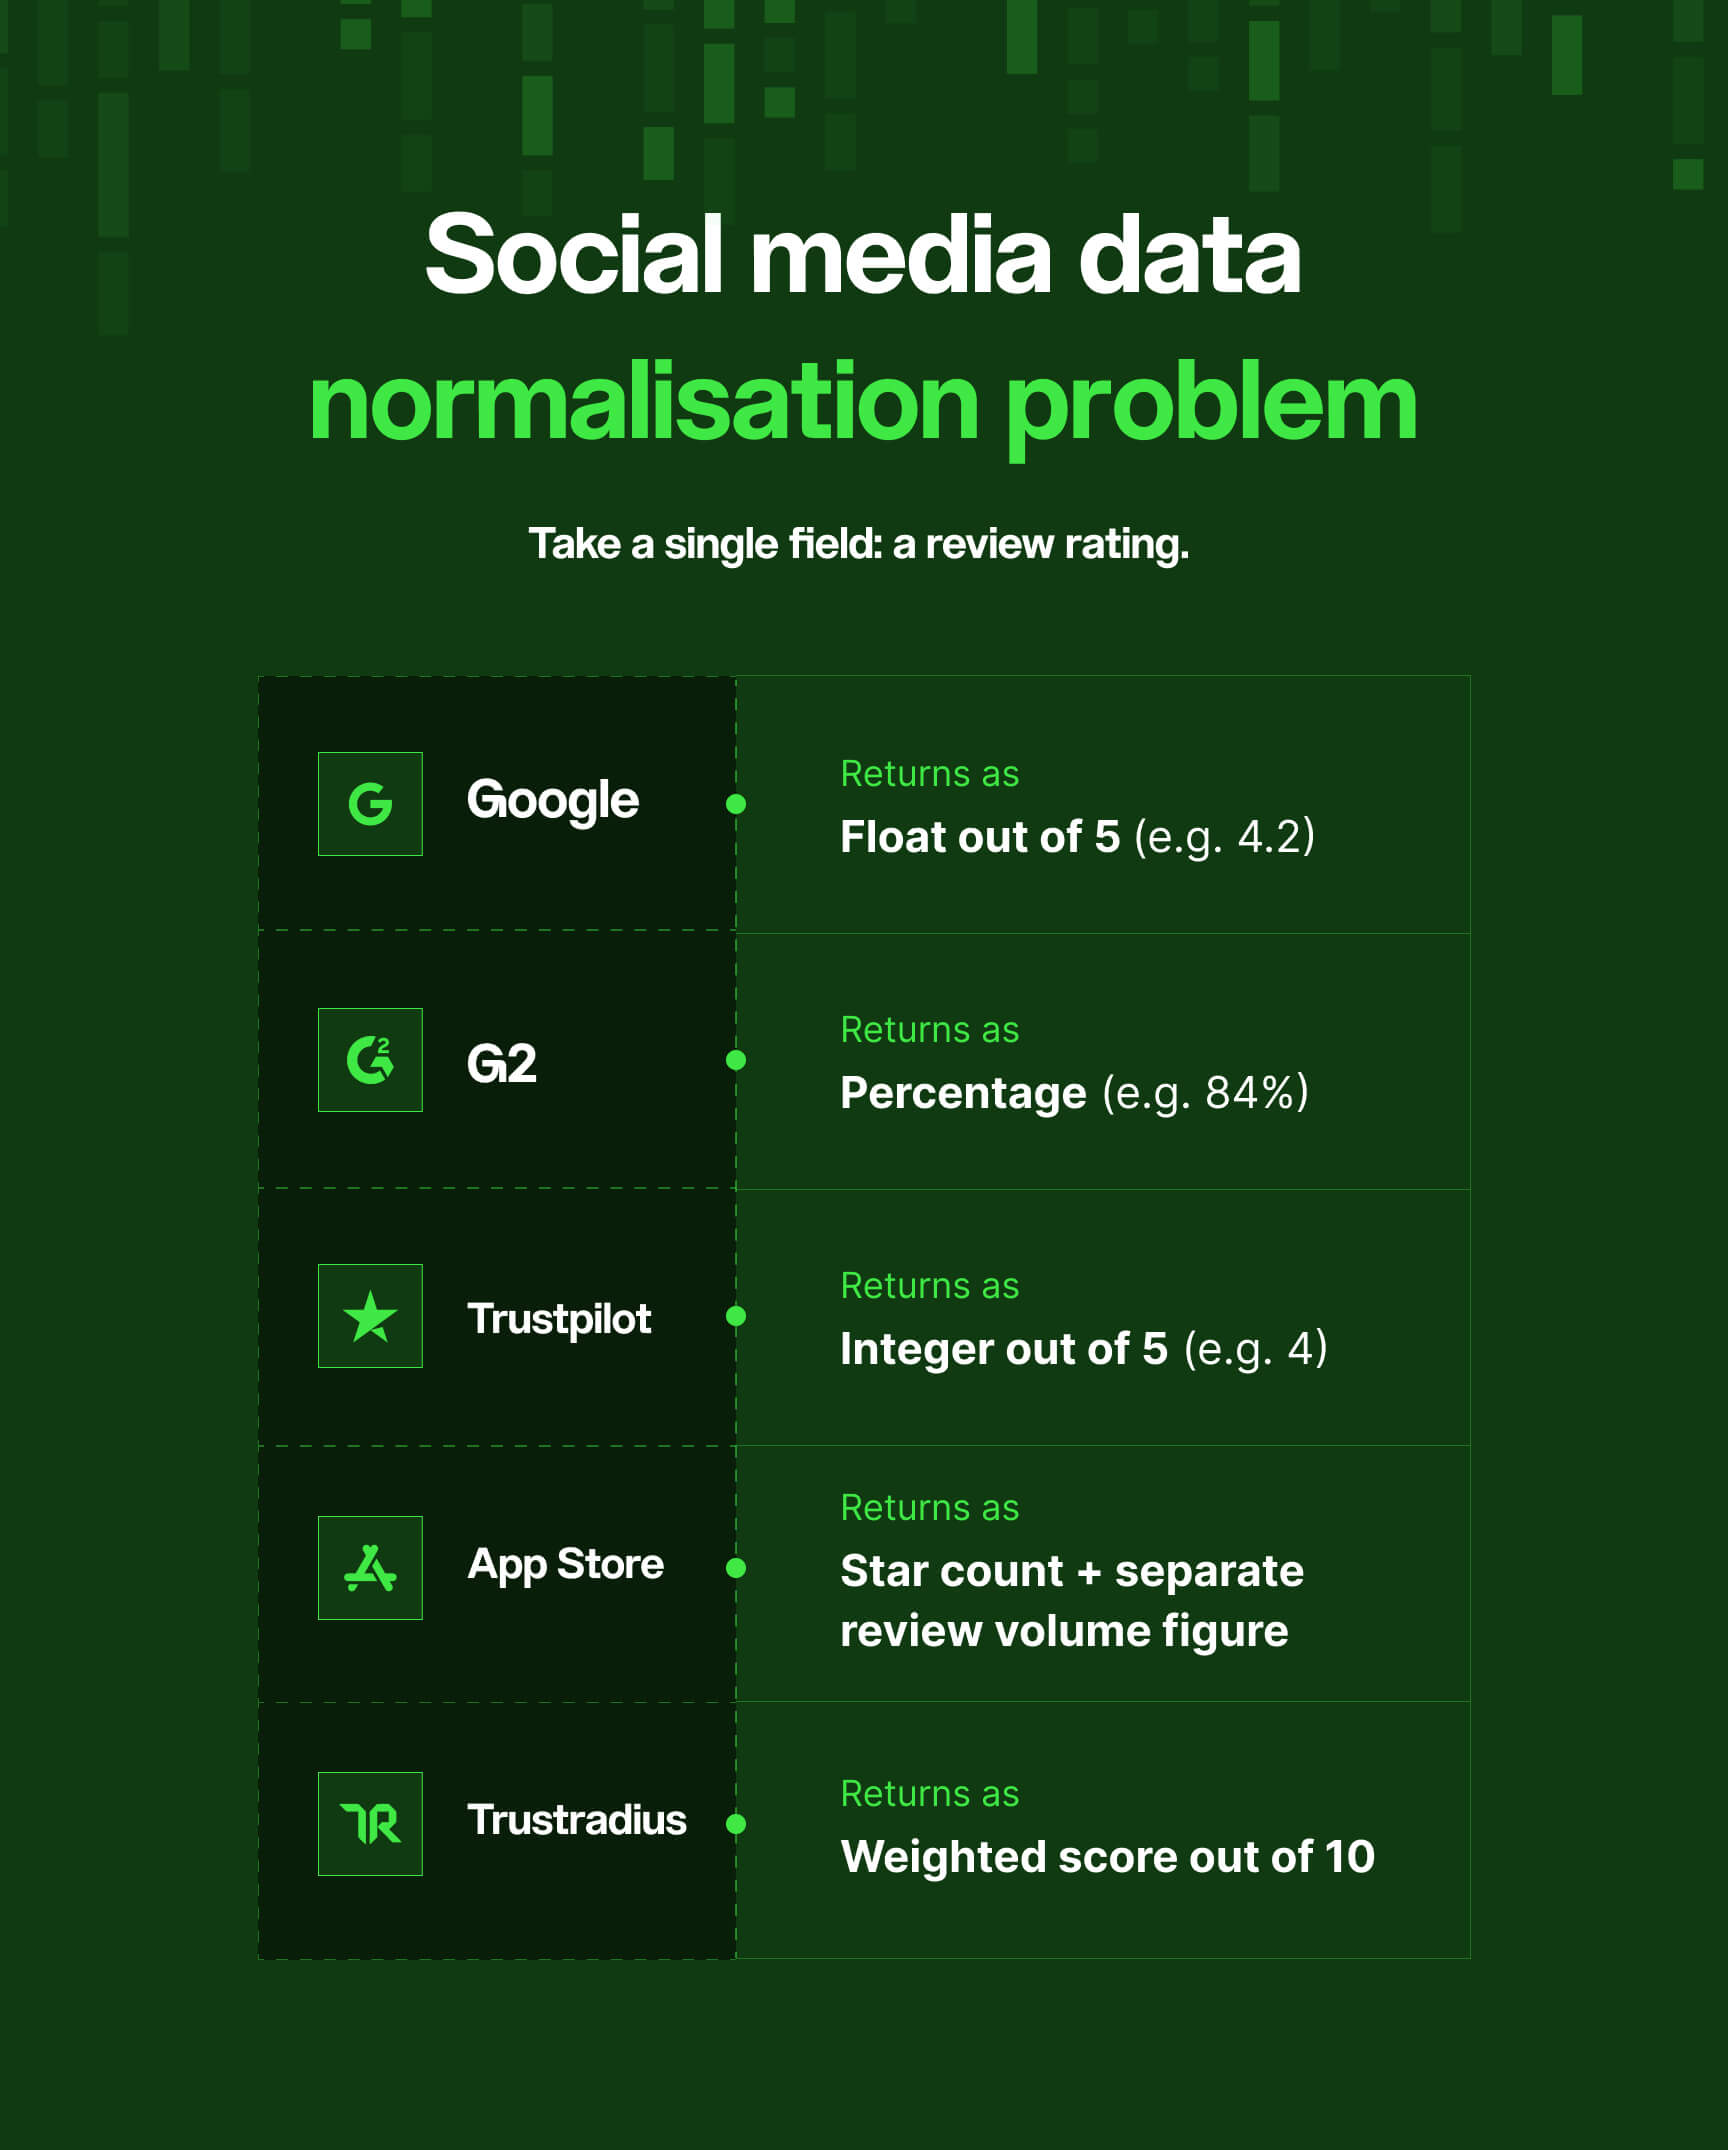
Before you can run a single cross-platform analysis, someone has to write logic that reconciles all of these: consistently, without data loss, at scale, and in a way that doesn't break when any one of those sources changes its response format.
Now multiply that across timestamps, author identifiers, content types, geographic tags, language metadata, sentiment fields, and source-specific fields that don't map to any equivalent elsewhere.
And in practice, the majority of teams don't have the time or resources to fully build and maintain internal tools for data pipeline automation. Even when companies succeed in building custom tools, those tools often degrade after the original developer leaves. The knowledge leaves with them.
👀 What this means for your team: When scoping a data collection project, add a normalisation phase to your estimate – and double it. Add a year-two and year-three maintenance estimate. Then ask whether the engineers who build it will still be there to maintain it.
The opportunity cost of building your own data pipeline
💡 Key takeaway: The most expensive cost of building a data collection pipeline rarely appears in the build estimate: it's the product work that doesn't happen while your engineers are building and maintaining infrastructure instead. Teams with significant infrastructure debt ship features 40–60% slower than competitors.
What are your engineers not building?
Every hour your engineers spend on data collection infrastructure is an hour they're not spending on the thing your customers pay for.
Amazon coined the phrase "undifferentiated heavy lifting" to describe exactly this kind of work – necessary, technically demanding, but not creating competitive advantage in the eyes of customers.
➡️ Maintaining API connectors
➡️ Handling rate limit logic
➡️ Rebuilding broken scrapers
➡️ Normalising schemas.
This work has to get done. But it doesn't have to be done by your team.
What is opportunity cost in software engineering?
Opportunity cost in engineering is the value of the work your team doesn't do because their time is spent on something else. It compounds directly into your competitive position: through features that ship late, roadmap items that keep getting pushed, and product improvements that never quite make it to the top of the queue.
For teams building their own social or review data collection infrastructure, the opportunity cost is pretty specific and measurable: every hour spent on connector maintenance, schema updates, API deprecation responses, and pipeline debugging is an hour not spent building the product your customers pay for.
How to calculate the opportunity cost before you start a build
Before committing to any significant data collection build, work through these four questions:
1. Which roadmap items will slip?
Map the engineering capacity the build will consume against your current roadmap. Which features will be pushed as a direct result? Be specific and name the items, not just the sprints.
2. What is the revenue or retention impact of those delays?
For each slipped item, estimate the business impact. Lost upsell opportunities, delayed expansion into a new segment, a customer-facing feature that competitors ship first. Assign a number, even a rough one.
3. What is the ongoing maintenance cost in engineering time?
Don't just estimate the build. Estimate year two and year three. How many sprint cycles per quarter will go to connector maintenance, schema updates, and platform deprecation responses? What roadmap items will those cycles displace?
4. What is the total, not just the build?
Add the initial build cost, the ongoing maintenance cost, and the opportunity cost of deferred product work. That's the real number. Compare it against the cost of a provider who has already solved the problem.
💡 Want to go deeper on this? Before committing to a build, it helps to understand what social data is worth to the business, and how to frame that value internally. Sentiment Is Not a Strategy: How to Use Social Data in Strategic Decision-Making →
Data collection compliance in 2026: what the law requires
What is data collection compliance, and why has it become harder?
Data collection compliance is the set of legal, regulatory, and contractual obligations that govern how data is gathered, stored, processed, and used. This covers three distinct layers for teams collecting public social and review data:
1️⃣ Regulatory compliance – the statutory requirements of laws like GDPR, CCPA, and the expanding set of US state privacy laws that define what data can be collected, how it must be handled, and what rights individuals have over it.
2️⃣ Platform terms of service – the contractual obligations imposed by each platform you collect from, which often include explicit restrictions on automated collection, data storage, commercial use, and redistribution. These are separate from regulation and enforced by the platform directly.
3️⃣ Sector and jurisdictional requirements – additional rules that apply depending on what the data is used for and where your customers are. Healthcare data, financial data, and data involving minors each carry additional compliance layers on top of the baseline.
Platform ToS is its own compliance layer on top of all of this
On top of regulatory exposure, every platform you collect from has its own terms, and they change without much notice.
Each platform – G2, Trustpilot, TripAdvisor, the major social networks – has its own terms of service, some of which explicitly ban automated collection. Many change their policies without notice. Ignoring these terms can lead to IP bans, legal action, or revoked partnerships.
In the review data space specifically, G2 averaged a 36.63% success rate in independent anti-scraping benchmarks — meaning more than half of collection attempts against it fail without the right infrastructure and ongoing maintenance. Staying compliant while maintaining coverage is a full-time job.
A compliance-first data provider absorbs this risk and tracks the changing landscape as part of their core service. A homegrown pipeline transfers it directly to the business.
What this means for your team: Before building any data collection pipeline, map the compliance requirements: which regulations apply, which platforms have explicit terms prohibiting automated collection, and who in your organisation owns ongoing monitoring when those rules change. If that person doesn't exist yet, that's the first problem to solve.
The true cost of building a social data pipeline in-house: a three-year view
Teams tend to model the initial build – engineering time, infrastructure, a few weeks of testing – and compare that against the annual cost of a provider.
What that model misses is everything that happens after launch:
- The maintenance
- The unplanned incidents
- The platform deprecations
- The normalisation overhead as new sources get added
- The compliance work
- And the product velocity lost to all of the above.
When you include those costs, the comparison changes substantially.
Here's what the full picture actually looks like ⬇️
Year one: the build costs
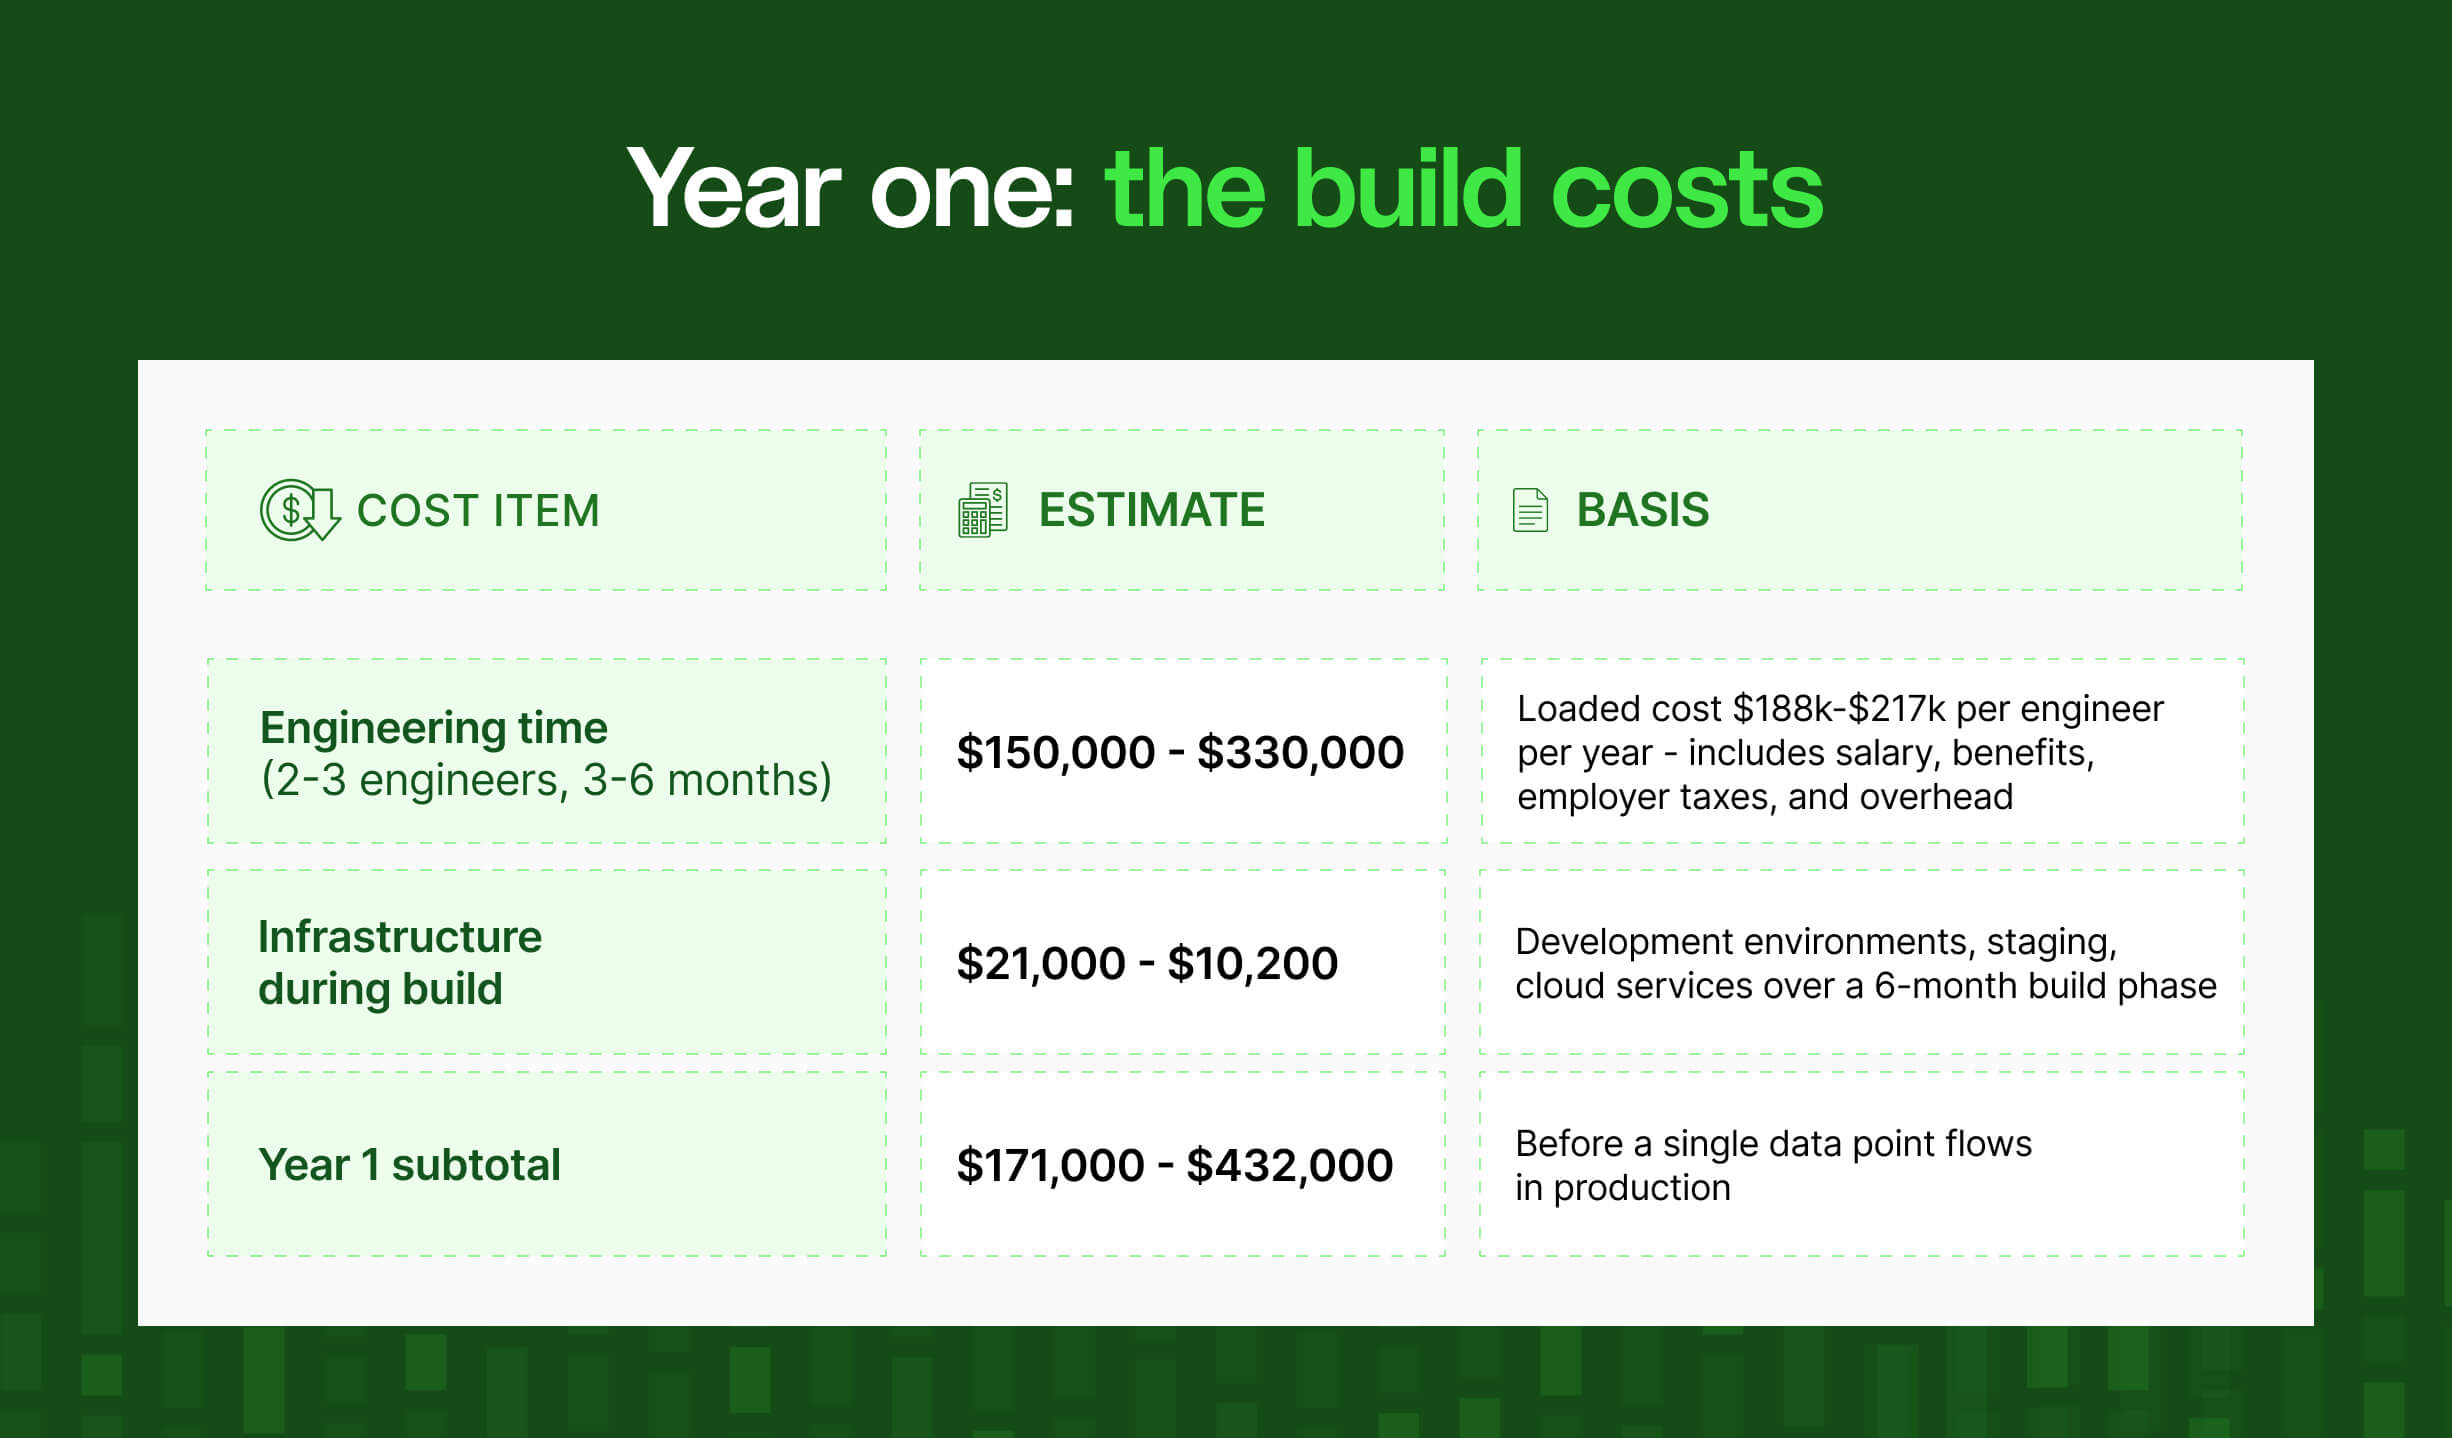
Assumptions
1️⃣ First, the three-to-six month timeline assumes a relatively focused team working on a well-scoped problem. Multi-source pipelines with complex normalisation requirements routinely take longer.
2️⃣ Second, this doesn't include the cost of the engineers' time being diverted from product work – which is opportunity cost, covered separately below.
3️⃣ Third, once the pipeline is in production, the cost structure changes entirely.
Year two and beyond: the costs that compound
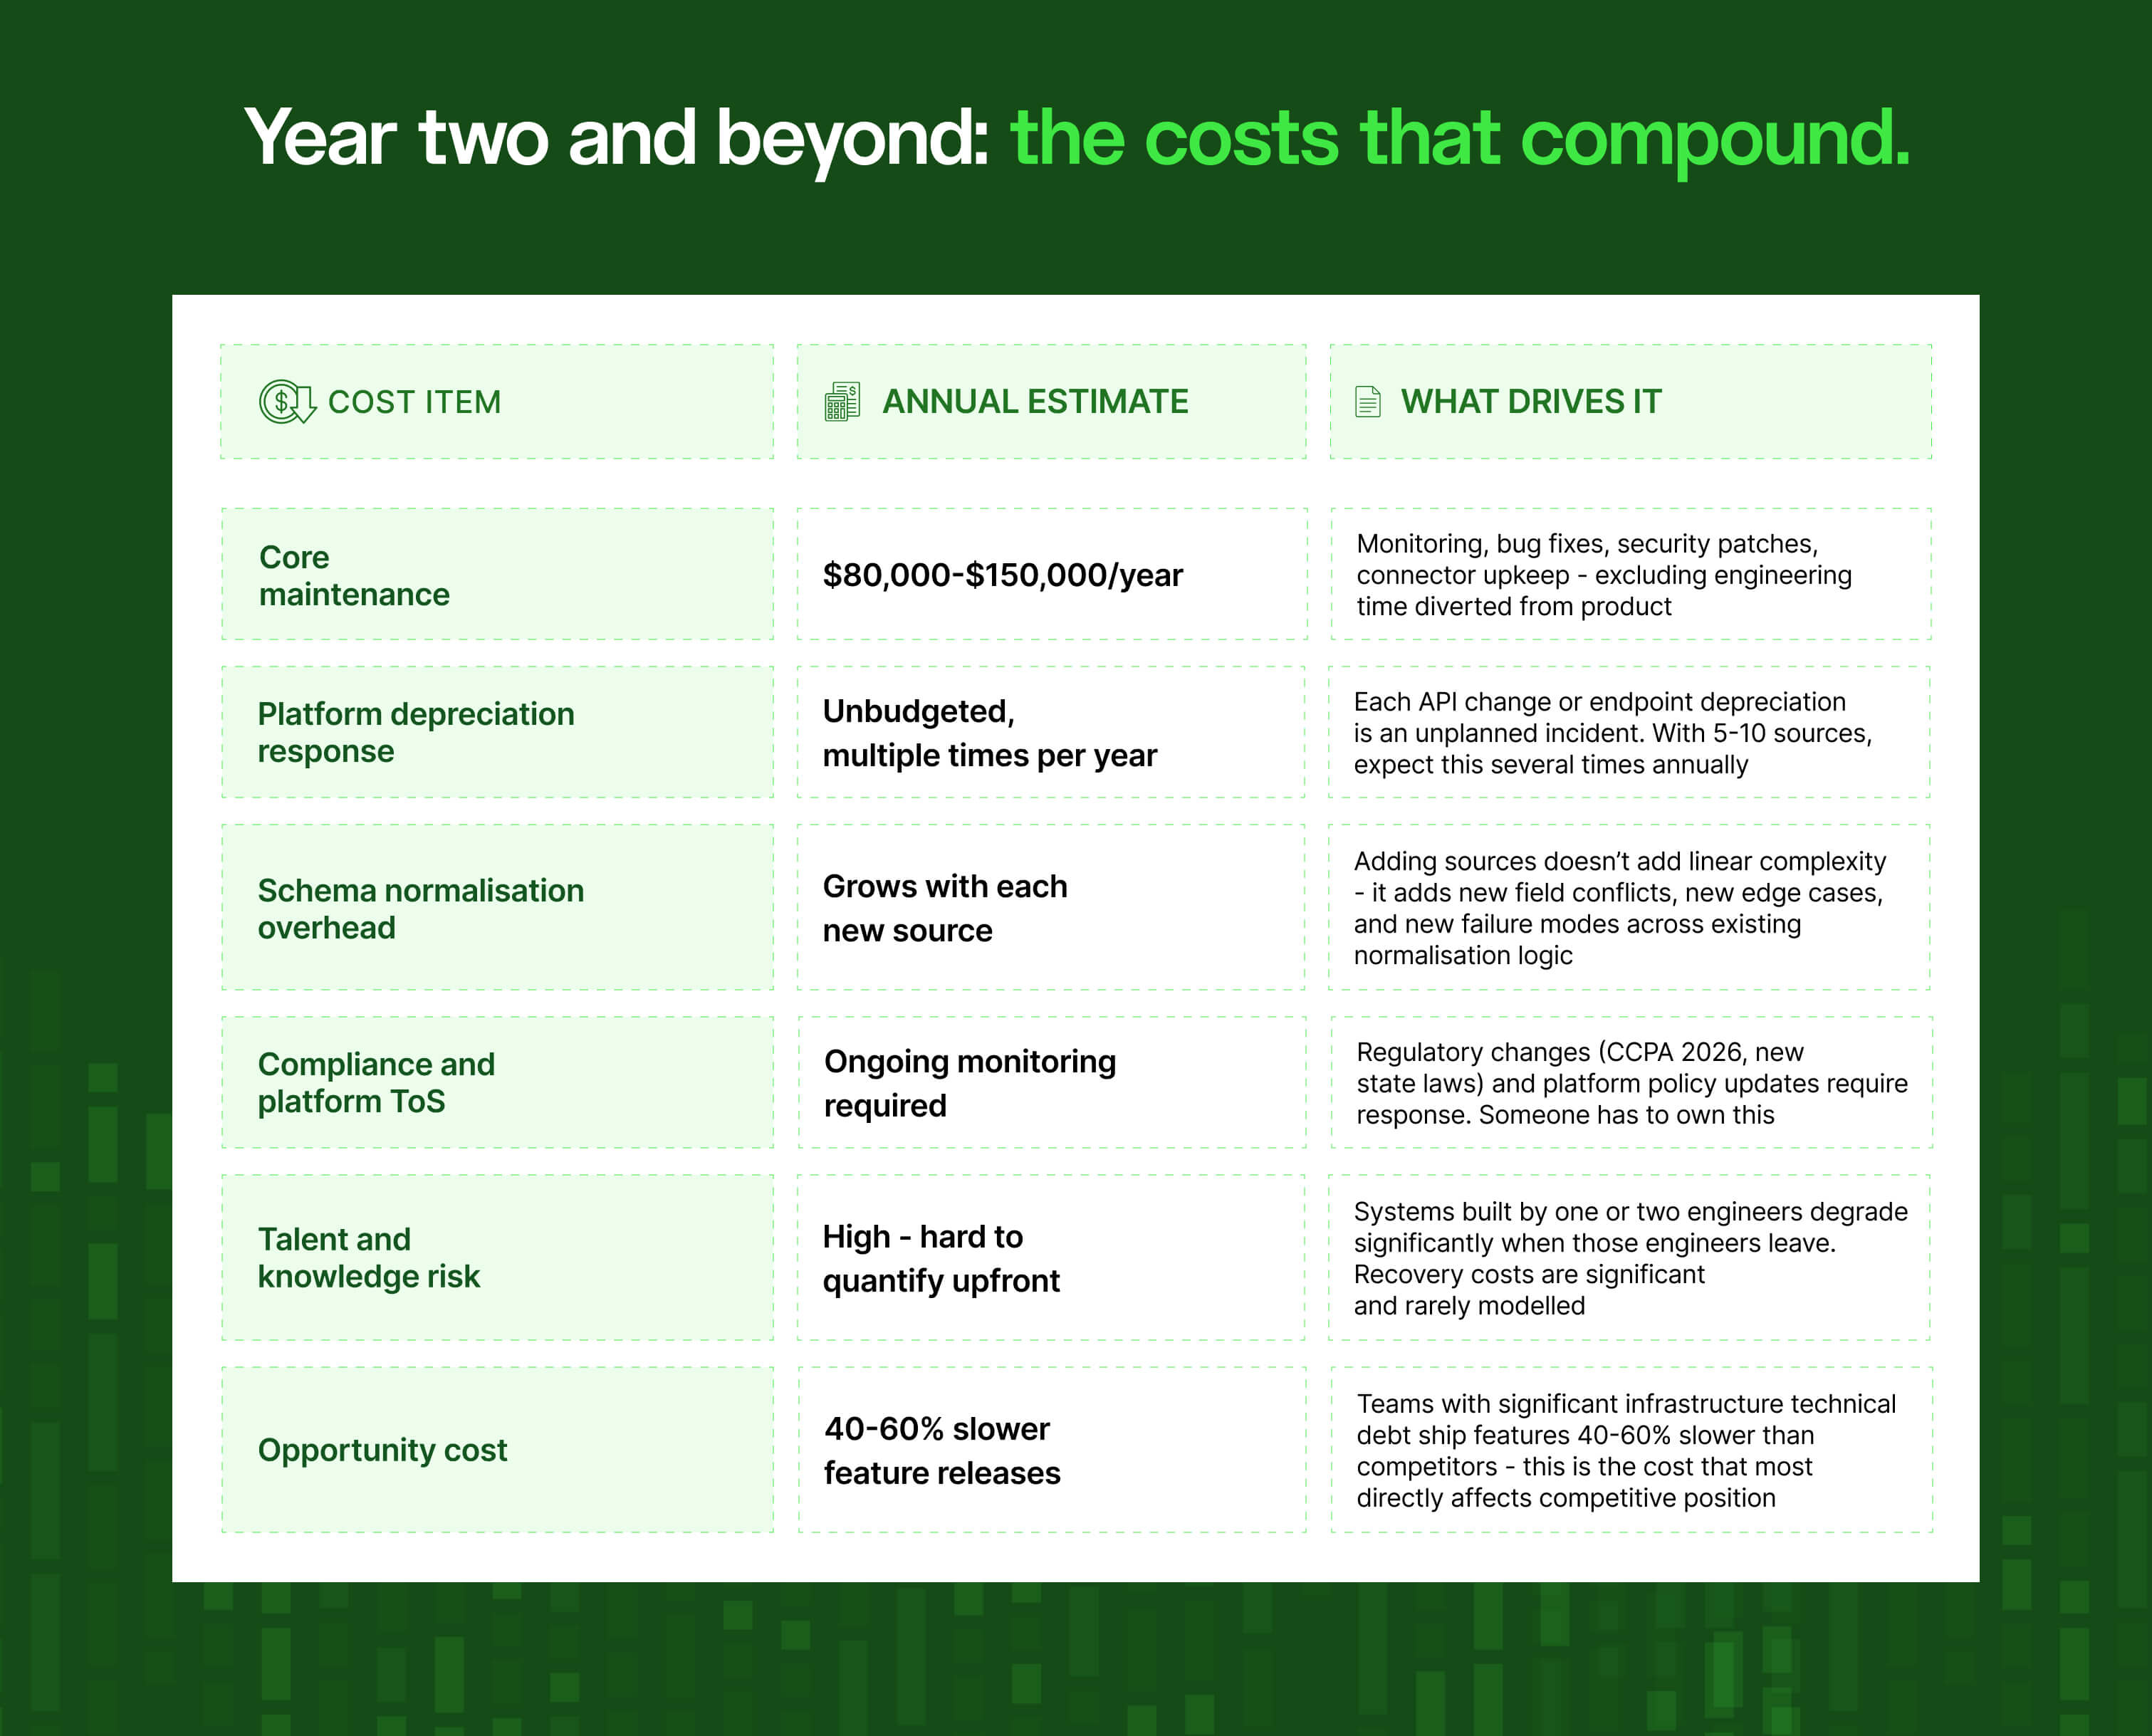
Lost coverage
There's a sixth cost that doesn't appear in any estimate, because it's defined by absence rather than expenditure: the data you're not collecting.
A homegrown pipeline covers the sources your team had capacity to build integrations for at the time of the build.
It doesn't cover:
❌ The sources added to the backlog but never prioritised
❌ The platforms that were too complex to integrate cleanly
❌ The niche forums, regional review sites, or community platforms that your customers are active on but that never made it to the top of the sprint queue.
That missing coverage creates analytical blind spots:
- Decisions get made on incomplete data
- Customers are monitored on four platforms when they're actually active on nine
- Competitive intelligence misses the conversations happening in the channels your pipeline doesn't reach.
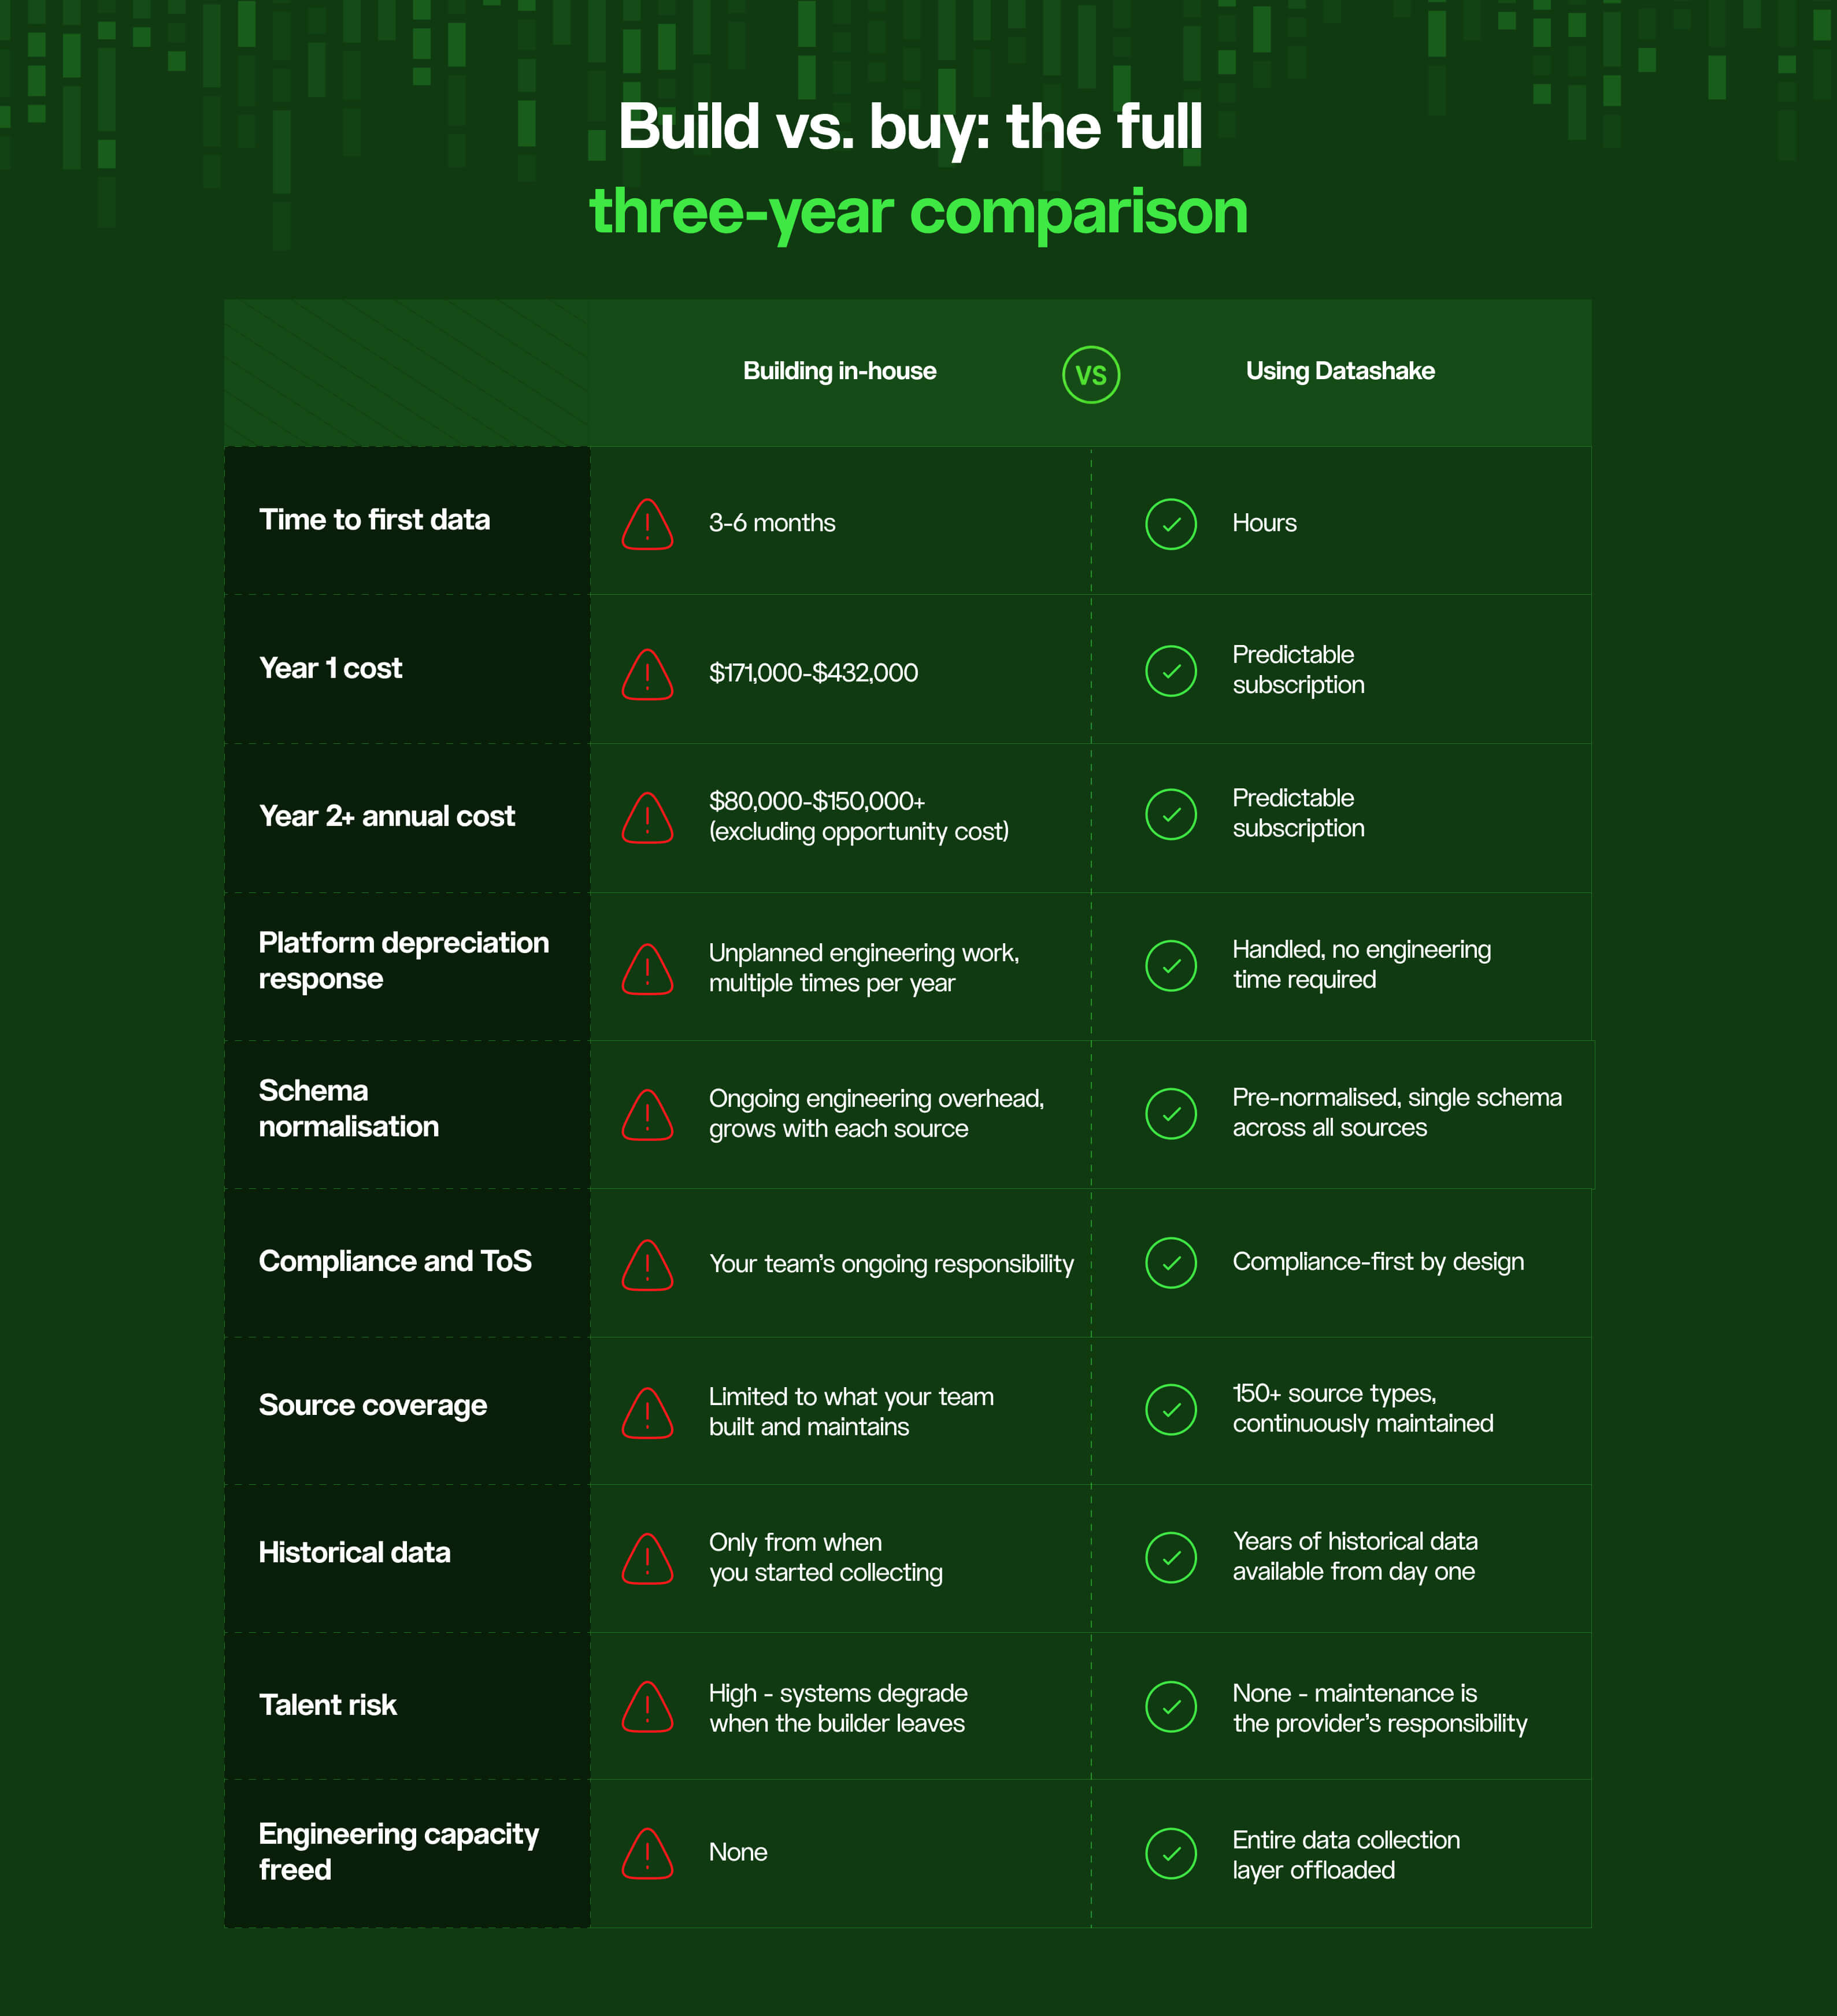
Build vs. buy: the full three-year comparison
When you add the initial build, the ongoing maintenance, the opportunity cost of slower product velocity, and the coverage gaps, the total cost of ownership for a homegrown pipeline looks substantially different from the initial estimate.
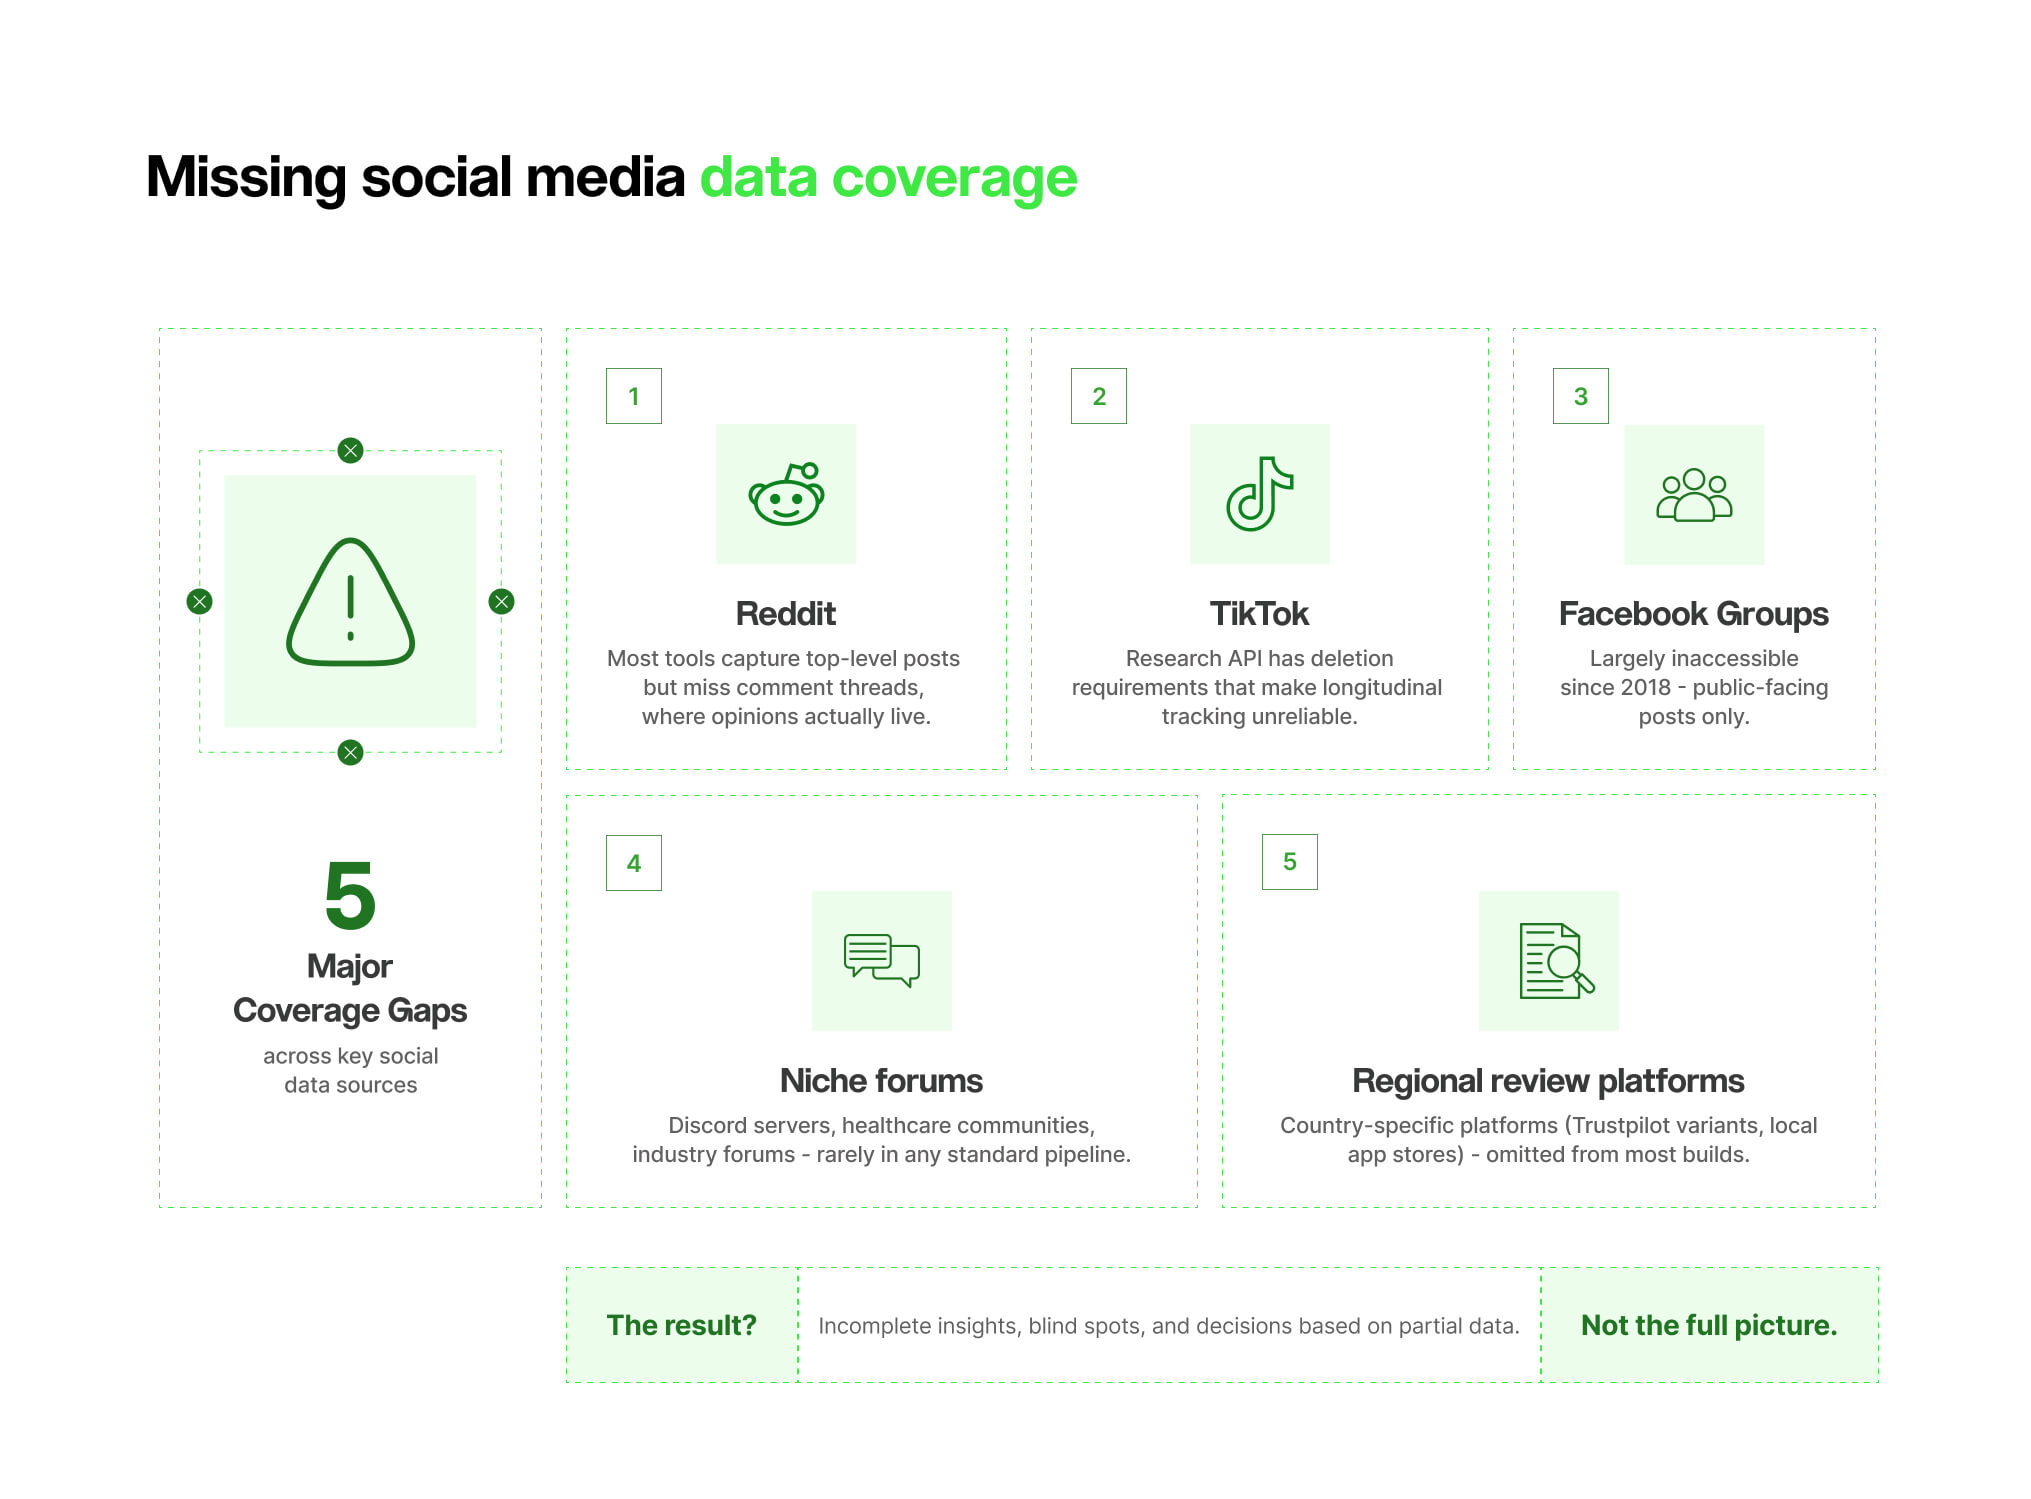
Social data coverage gaps: why building your own pipeline doesn't solve the whole problem
The majority of teams start with the obvious sources ➡️ the major social platforms, the well-known review sites, the channels they already know their customers use.
That's a reasonable starting point, and for the first few months, it feels like enough.
But then, cracks start to appear when someone asks a question the data can't answer.
- Why is churn spiking in this segment?
- What are customers actually saying about the onboarding flow?
- Is the negative sentiment showing up in our reviews isolated to one market, or is it broader?
These questions often can't be answered from the four or five sources a homegrown pipeline covers, because the conversations that would answer them are happening somewhere else.
The reason coverage stays incomplete is prioritisation. Adding new sources – niche forums, regional review platforms, community channels, app stores in secondary markets – is always important and never urgent.
It sits below the deprecation that needs fixing, the normalisation edge case someone discovered last week, the product feature the team has been promising for two sprints. The sources that didn't make the initial build accumulate in the backlog, and the backlog doesn't move as fast as the business needs it to.
Meanwhile, the gaps compound. A competitor launches in a market your pipeline doesn't cover. A product issue surfaces in a community your connectors don't reach. A segment of customers is highly active on a platform that never made it to the top of the queue.
You can’t see what’s missing
The deeper problem is that incomplete coverage is invisible. The dashboard looks complete because it shows everything it's been given. It has no way to show you what it's missing.
So decisions get made, analyses get published, strategies get set – all based on a picture that's more incomplete than anyone realises, because the gaps have never been formally measured or acknowledged.
The solution
What changes the equation is removing the coverage problem from your engineering team's responsibility entirely.
A provider who already maintains integrations across 150+ source types means your team isn't choosing which sources to collect from based on what they have capacity to build. They're choosing based on what's actually relevant to the question they're trying to answer.
It also means coverage expands without adding engineering overhead. When a new platform becomes relevant – a rising community, a regional review site, a forum gaining traction in your industry – you don't need to scope an integration and wait two sprints. You query it.
So your team's time shifts from data collection, which is a logistics problem, to data analysis, which is where the actual business value lives.
💡 See what 150+ sources of normalised social and review data looks like in practice – explore Datashake's coverage.
When does building your own data collection pipeline make sense?
Everything in this post has made the case that building your own social data collection infrastructure is more expensive, more complex, and more risky than most teams account for.
But that’s not universal. There are situations where building is genuinely the right decision. ⬇️
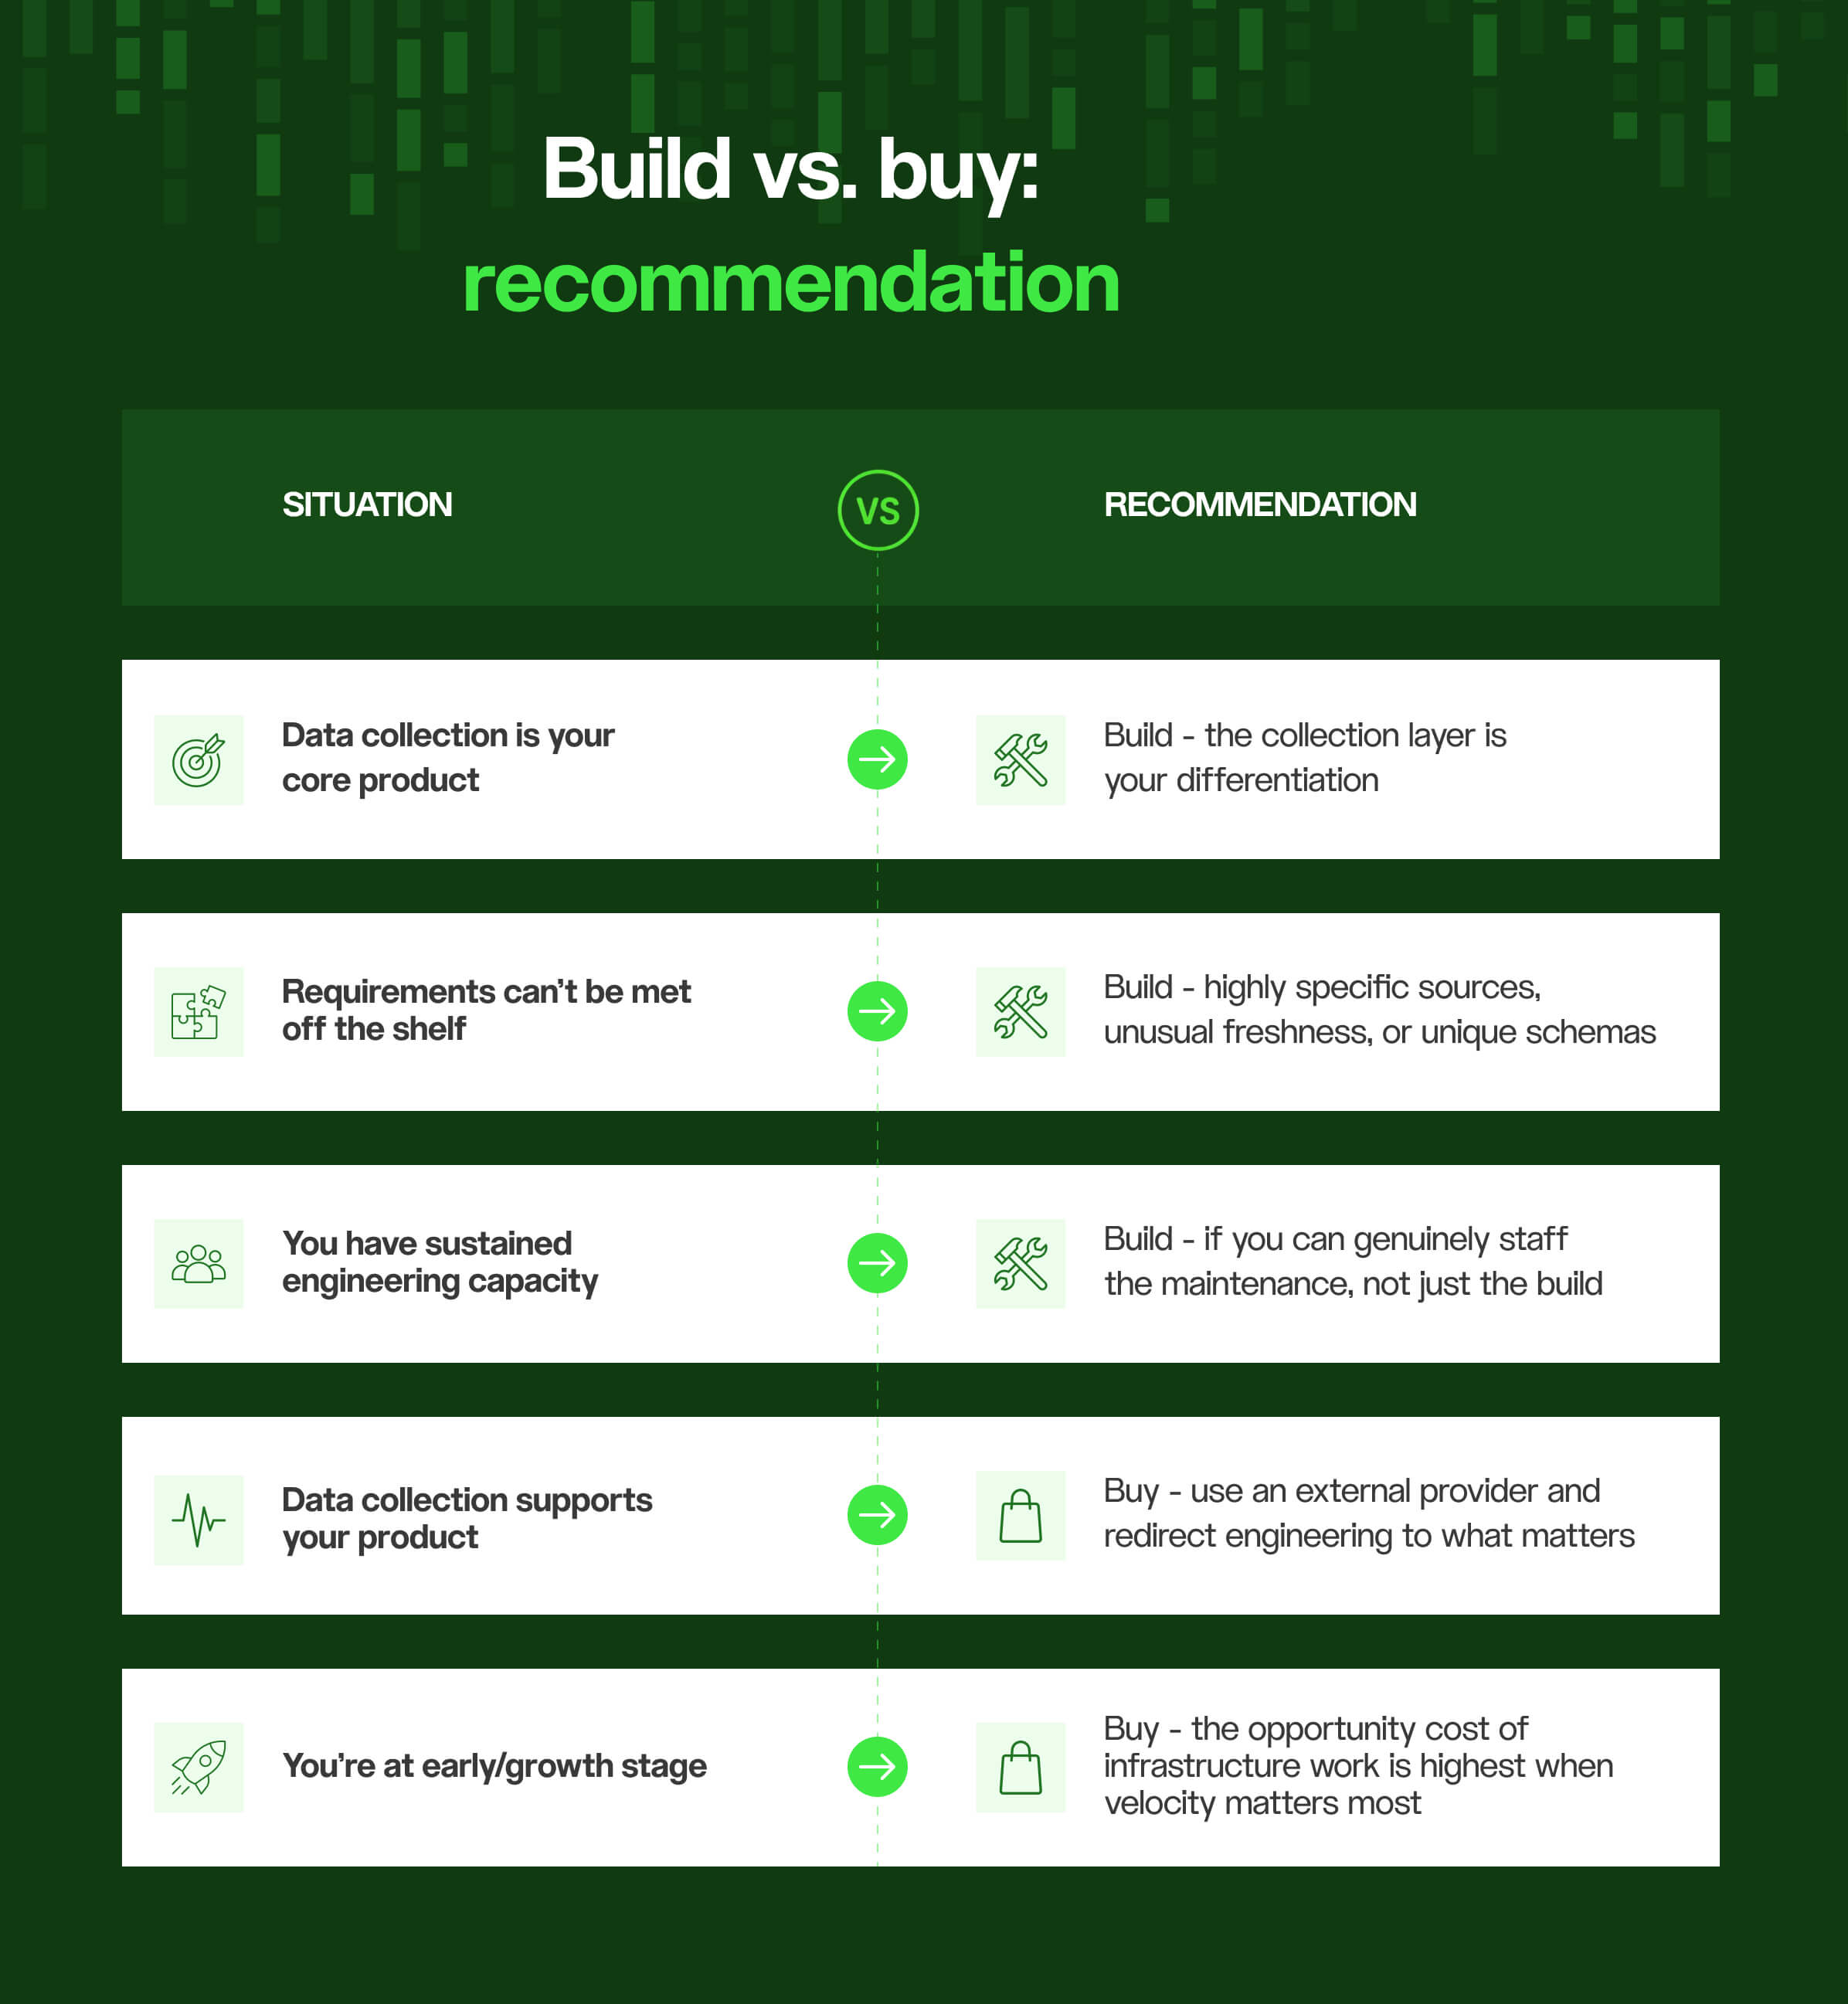
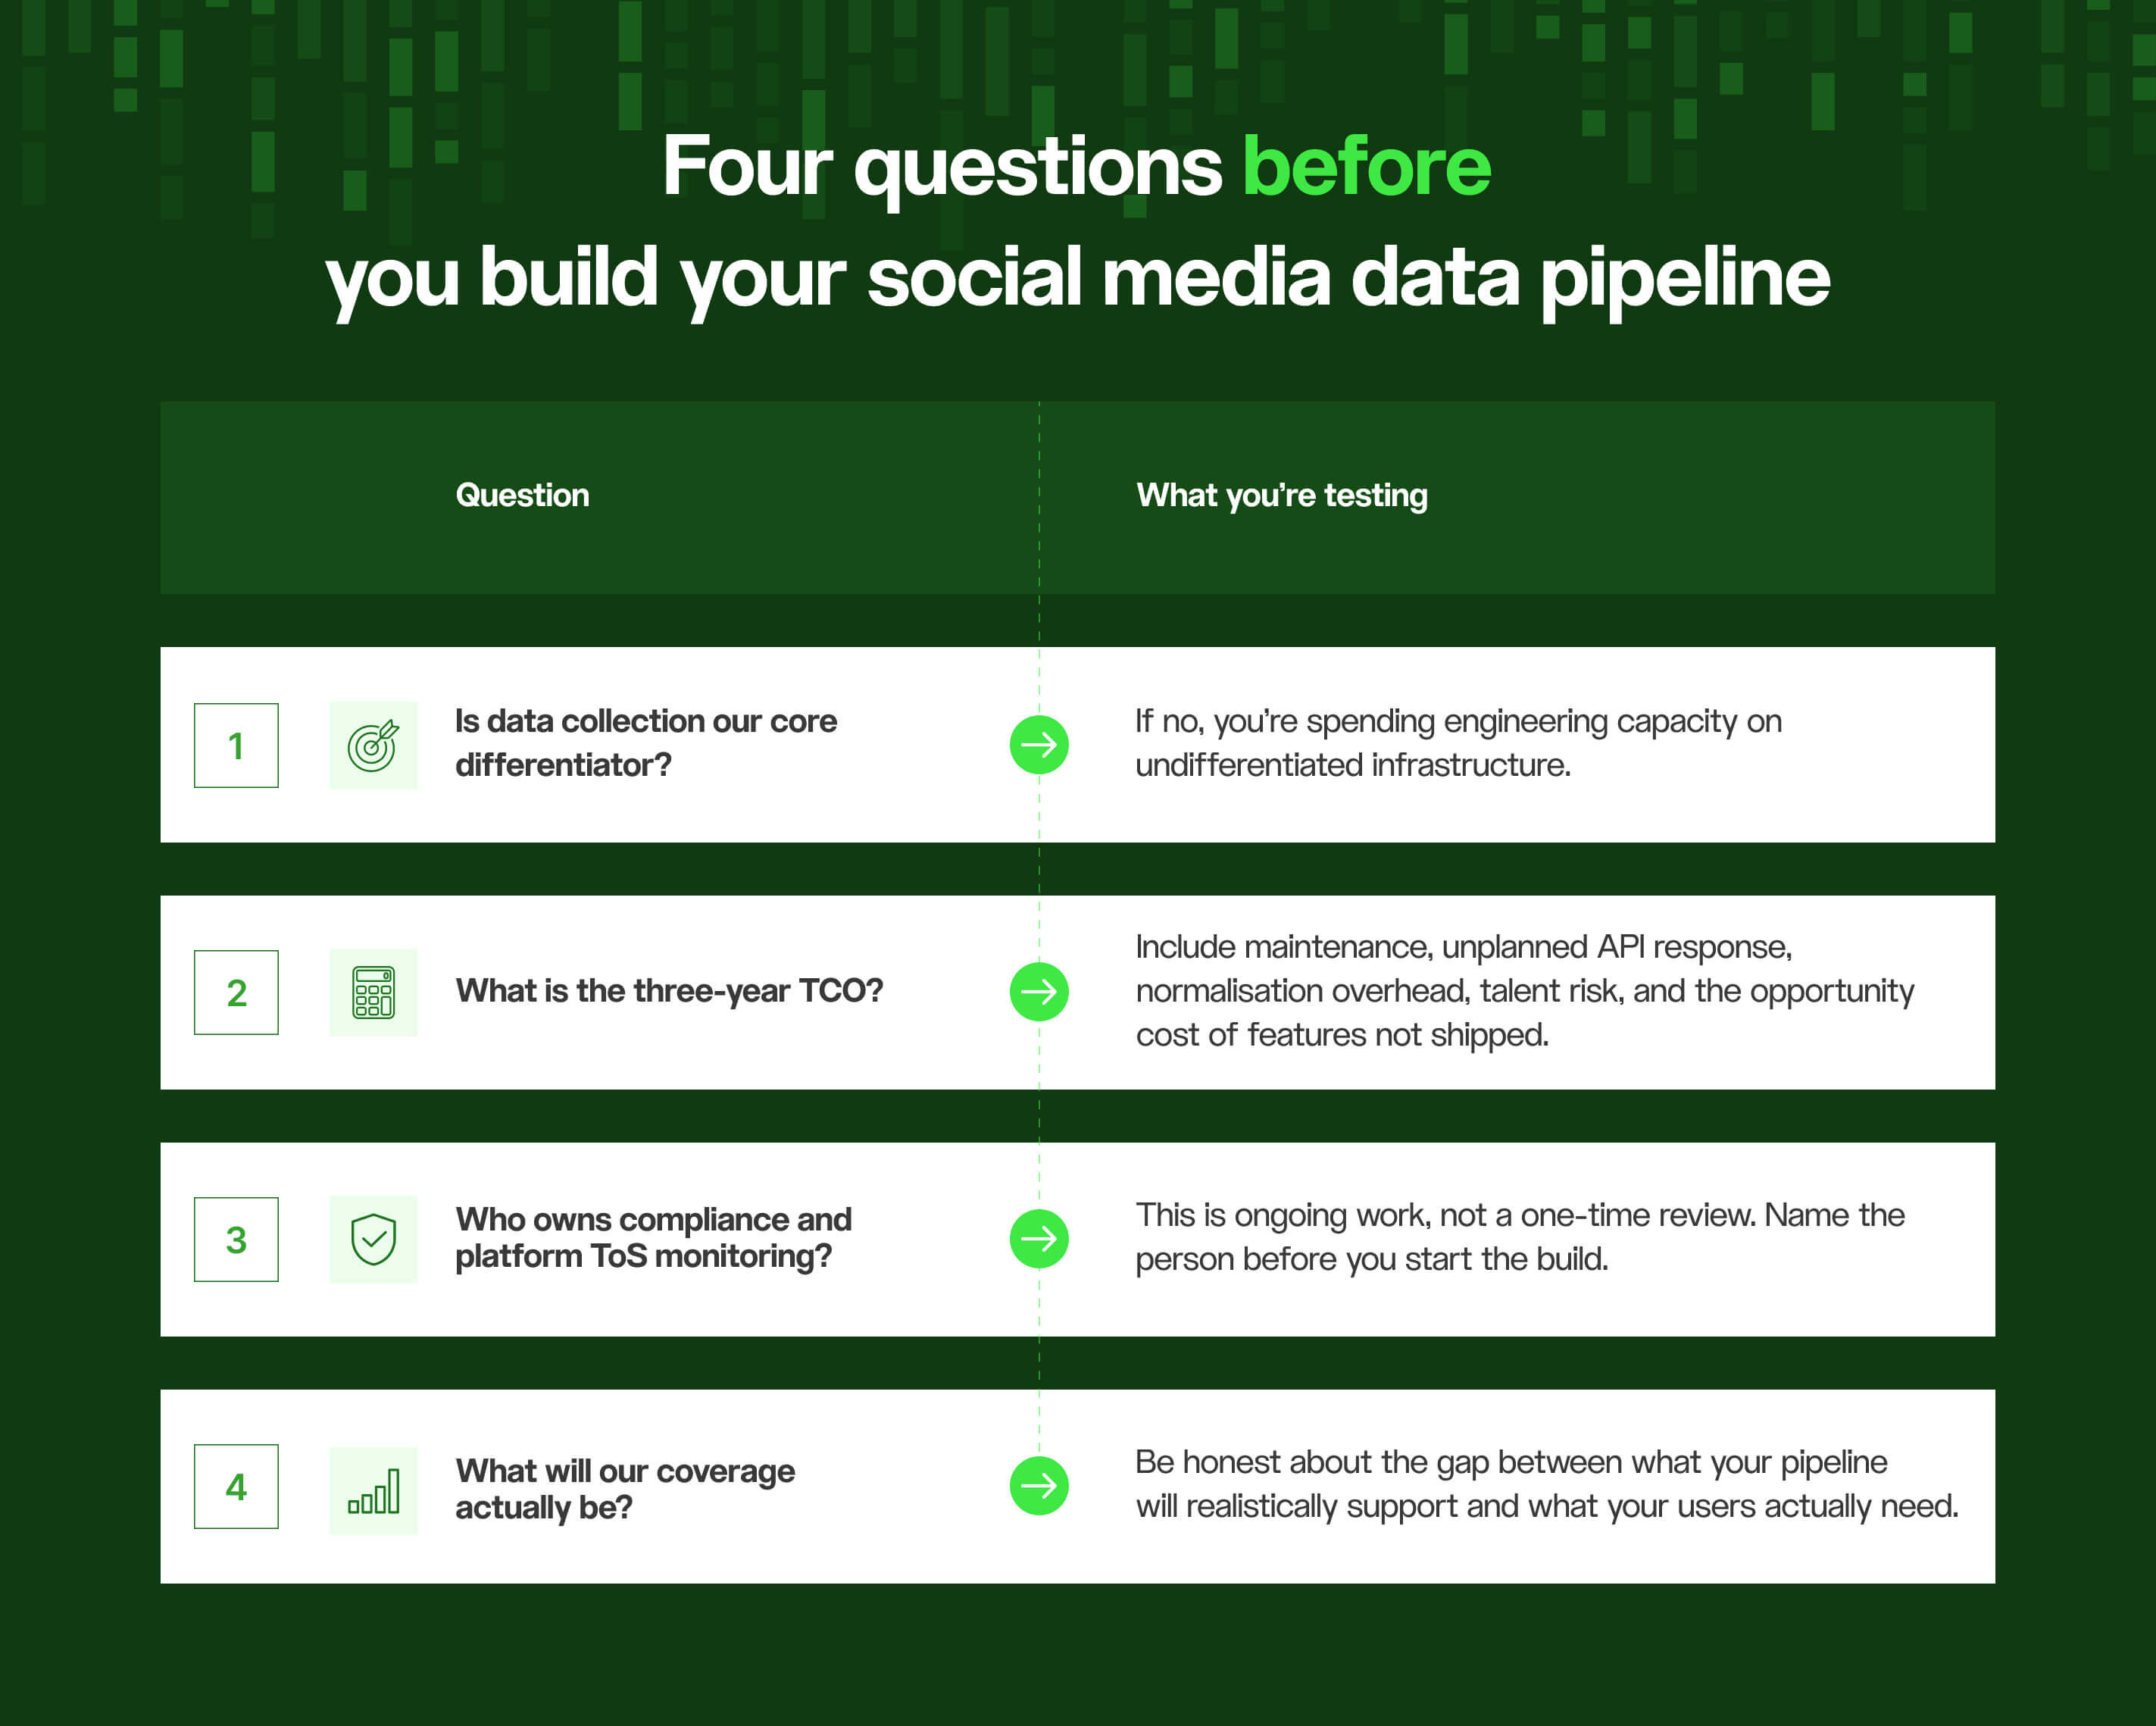
Four questions before you build your social media data pipeline
If you're evaluating a data collection build, answer these four questions before you start:
The bottom line
The complexity of data collection doesn't kill businesses overnight. It does it gradually – through engineering time redirected to maintenance, product cycles stretched by infrastructure debt, compliance exposure that nobody fully owns, and teams spending their best capacity on problems that aren't their core problem to solve.
Data quality issues affect nearly one-third of organisational revenue. Broken pipelines slow analytics programs, maintenance burden compounds. And the platforms that supply the data are increasingly treating access as a premium commercial asset.
Your engineers can almost certainly build a data collection pipeline. But what won’t they be building while they do, and is that trade-off worth it?
Datashake gives you one API, one normalised schema, and access to social and review data across hundreds of sources.


More insights you might like