How to Use Social Data to Stress-Test Survey Findings for Market Research
Ask a few thousand people whether they'd pay more for the sustainable option and plenty will say yes. Track what they actually put in the basket and the number deflates.
That's the difference between what someone tells a researcher and what they do when nobody's asking.
Surveys are a sharp tool in your market research toolkit, but they measure one thing: the answers people give to the questions you chose, in the wording you picked, at the moment you caught them. Social and review data measure what people said when there was no questionnaire in front of them.
Here’s how to use social data to stress test your market research survey findings ⬇️
What you'll learn
- Why surveys and social data fail in different ways, and why that's exactly what makes them useful together
- Four practical ways to validate survey findings against social data: convergent validation, divergence analysis, nowcasting, and sharper questions
- How to tell whether your two sources actually agree, using methods you can defend to a stakeholder
- Where social data falls short, and how to use it for market research
Who it's for
Market researchers, insights and consumer-intelligence teams, and anyone who runs surveys and wants a read on whether the findings hold up.
Quick answer
Market research teams use social data to stress-test survey findings by comparing survey results against organic social and review data; an independent source with different biases. When both point the same way, the finding is more reliable. When they diverge, the gap flags survey bias, a timing lag, or a group the survey missed.
What does it mean to stress-test survey findings?
Stress-testing survey findings means checking a survey's results against an independent dataset that fails in different ways. Because social and review data are generated differently from a survey, they catch what a survey misses: agreement raises your confidence in a finding, and disagreement flags a problem worth investigating.
The name for this is convergent validation, and it goes back to Campbell and Fiske's 1959 paper on measuring the same thing with methods that fail in different ways. Their point still holds: a finding you reach two independent ways is far more trustworthy than one you reach twice with the same tool.
Why surveys need a second opinion
None of this is an argument against surveys. It's an argument for knowing where they bend. Surveys have key weaknesses:
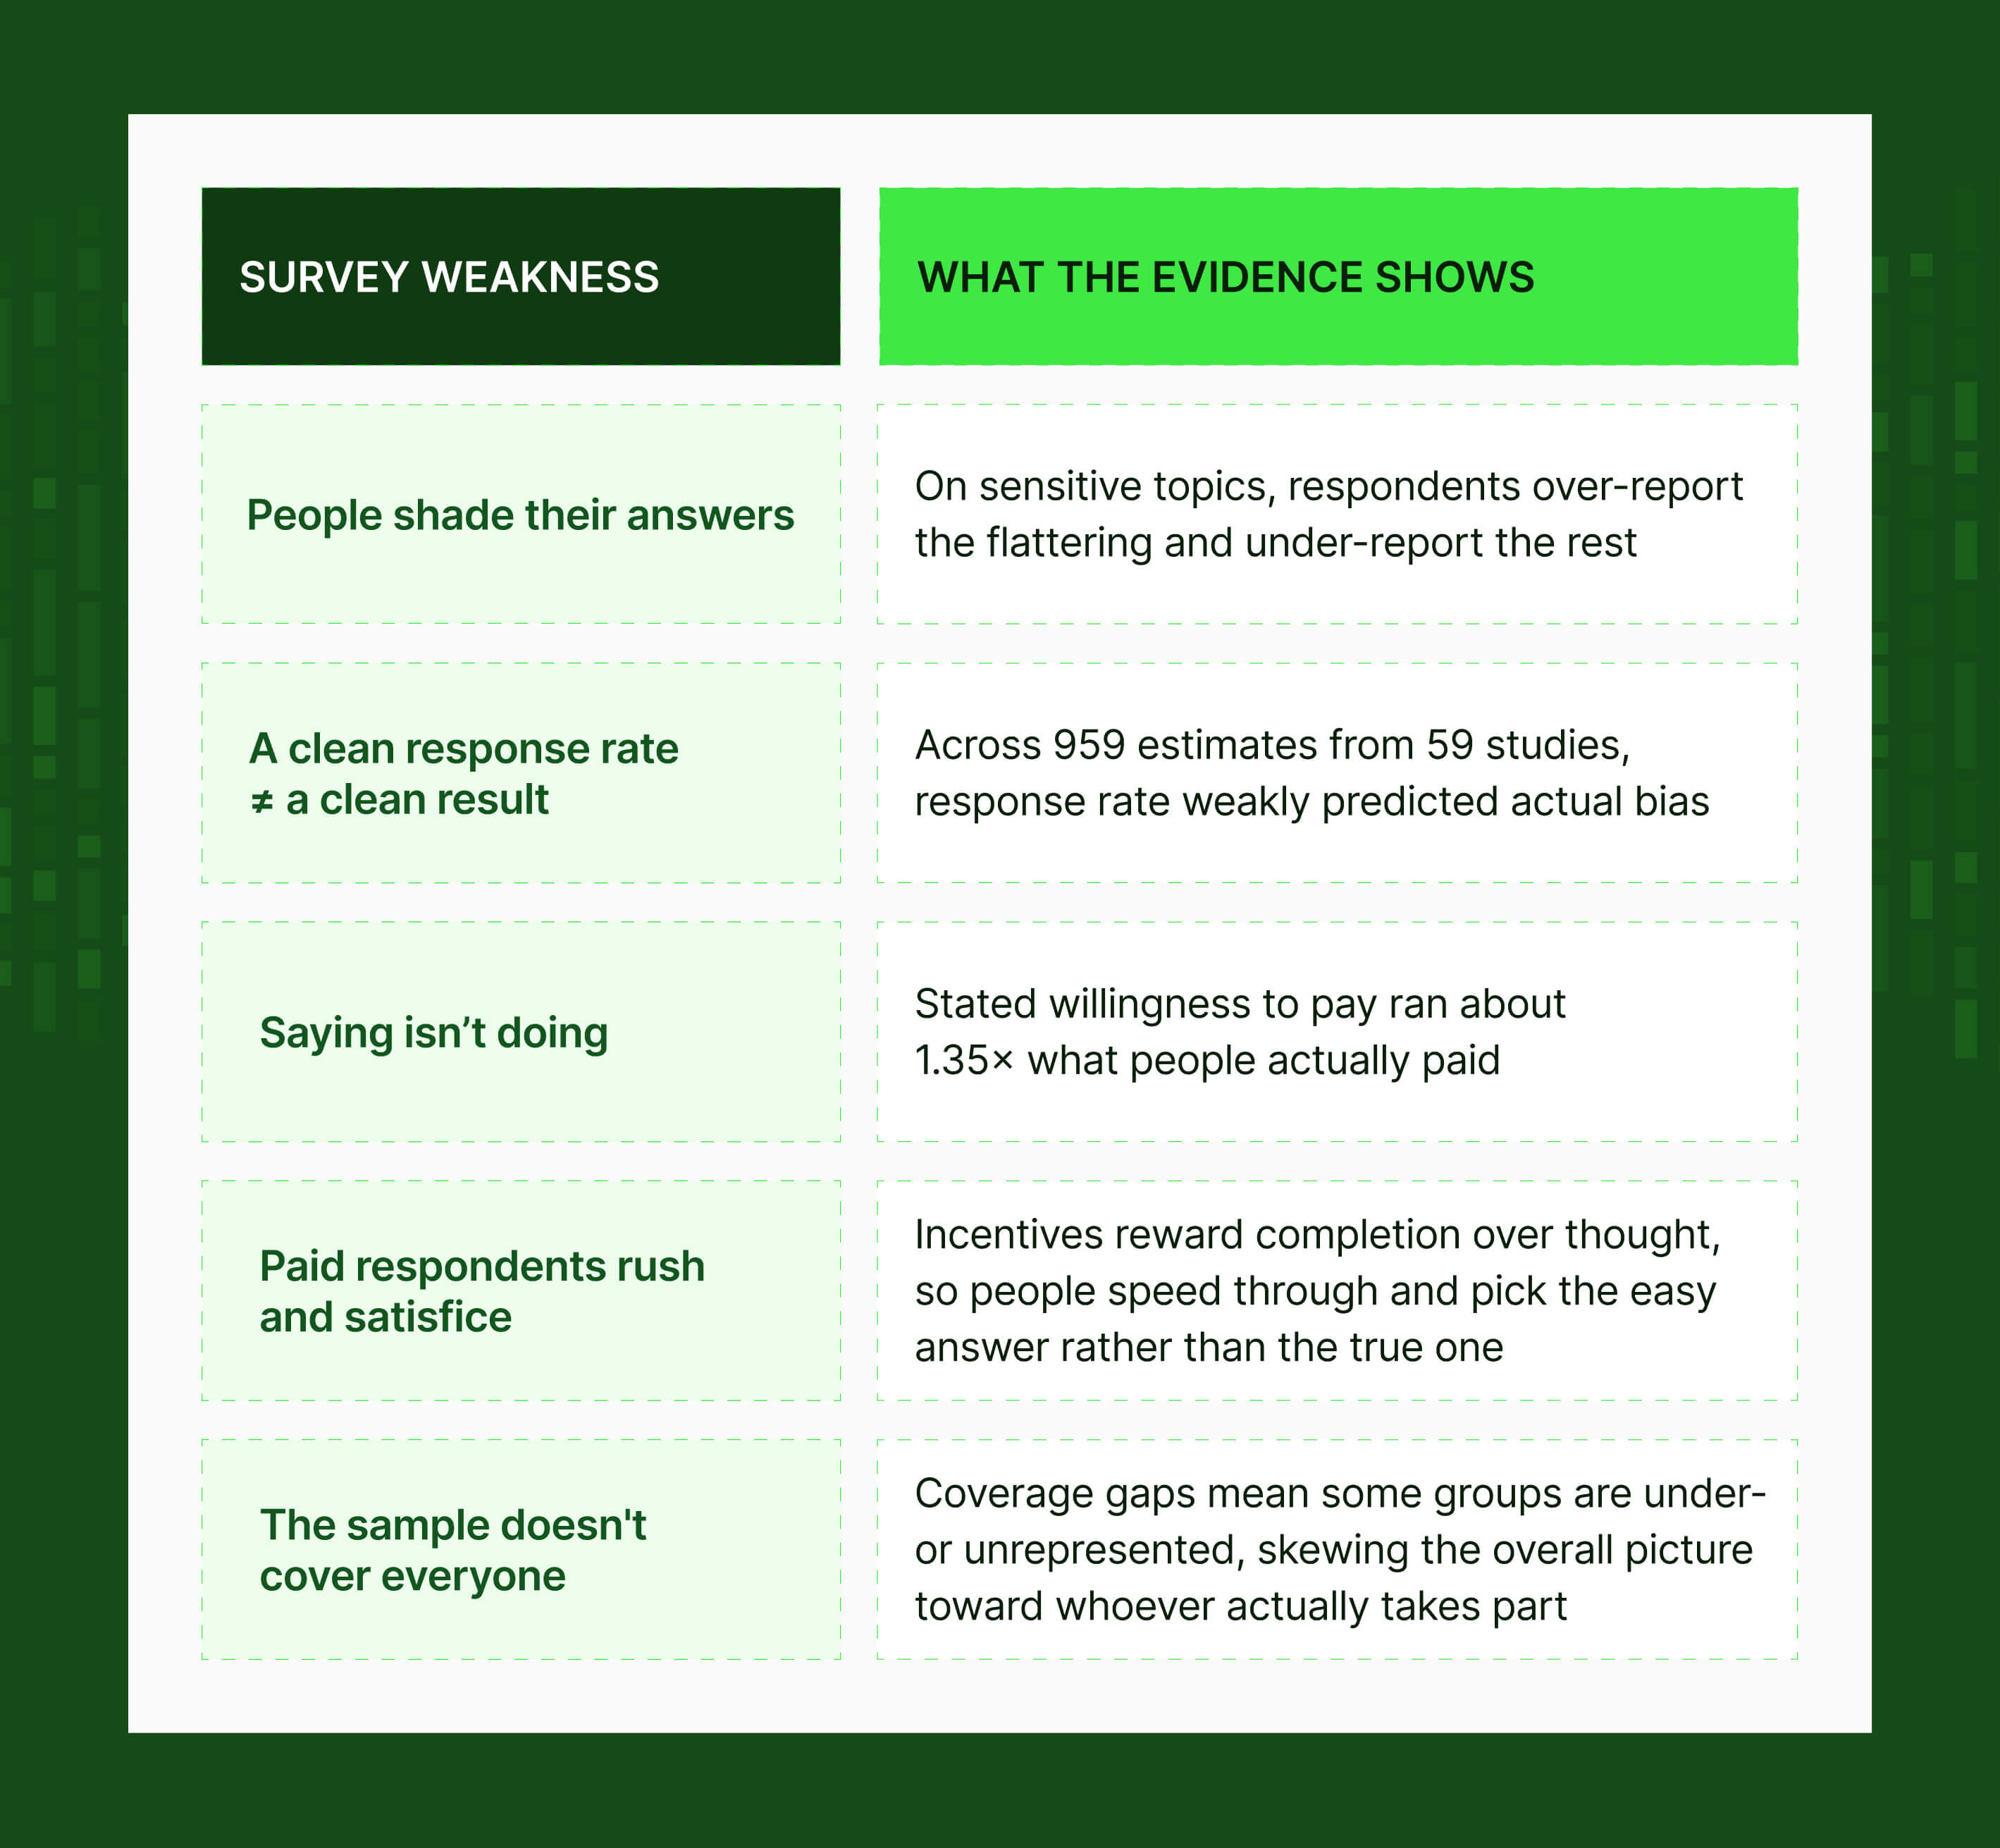
People shade their answers (social desirability bias)
- When a question touches something sensitive – money, health, habits, anything with a "right" answer – people lean toward the version that makes them look good.
- They over-report the flattering behaviours (voting, exercising, giving to charity) and under-report the awkward ones.
- So the survey isn't capturing what people do; it's capturing what they'd like you to think they do.
A clean response rate doesn't mean a clean result (nonresponse bias)
- It's tempting to treat a high response rate as proof the data is sound. What actually skews a survey is who declines. If the people who don't answer differ from the people who do, bias creeps in no matter how many responses you collect.
- A meta-analysis of 959 bias estimates across 59 studies found the response rate was a weak predictor of how much bias was actually present.
- In other words, you can hit your target sample size and still be measuring the wrong thing.
Saying isn't doing (stated vs revealed preference)
- People answer hypotheticals more generously than they act. Asking "would you pay more for X?" isn't the same as watching them pay.
- A review of hypothetical-versus-real valuation studies put the median gap at about 1.35×: stated willingness to pay ran roughly a third higher than what people actually handed over.
Why combine survey data with social data?
A survey is elicited data. You prompt someone, and they answer inside a frame you built: your questions, your wording, your answer options, your timing. That structure is what makes surveys powerful, but it also bakes in a set of distortions – people manage how they look, misremember, or say what the question nudges them toward.
Social and review content is unelicited. Nobody prompted it, so it sidesteps every one of those framing problems. But being unprompted brings its own distortions: you only hear from people who chose to post, and a loud few tend to dominate.
And silence cuts both ways. A survey's guaranteed anonymity can coax out honest answers on sensitive subjects that people would never attach their name to in public. As online shaming gets more common, plenty simply won't touch a charged topic where they can be identified.
So on the most sensitive questions, the two sources fail in opposite directions: a survey can pull answers upward toward the socially acceptable, while public conversation can go quiet altogether. Neither gives you the full picture alone, which is the reason to read them side by side.
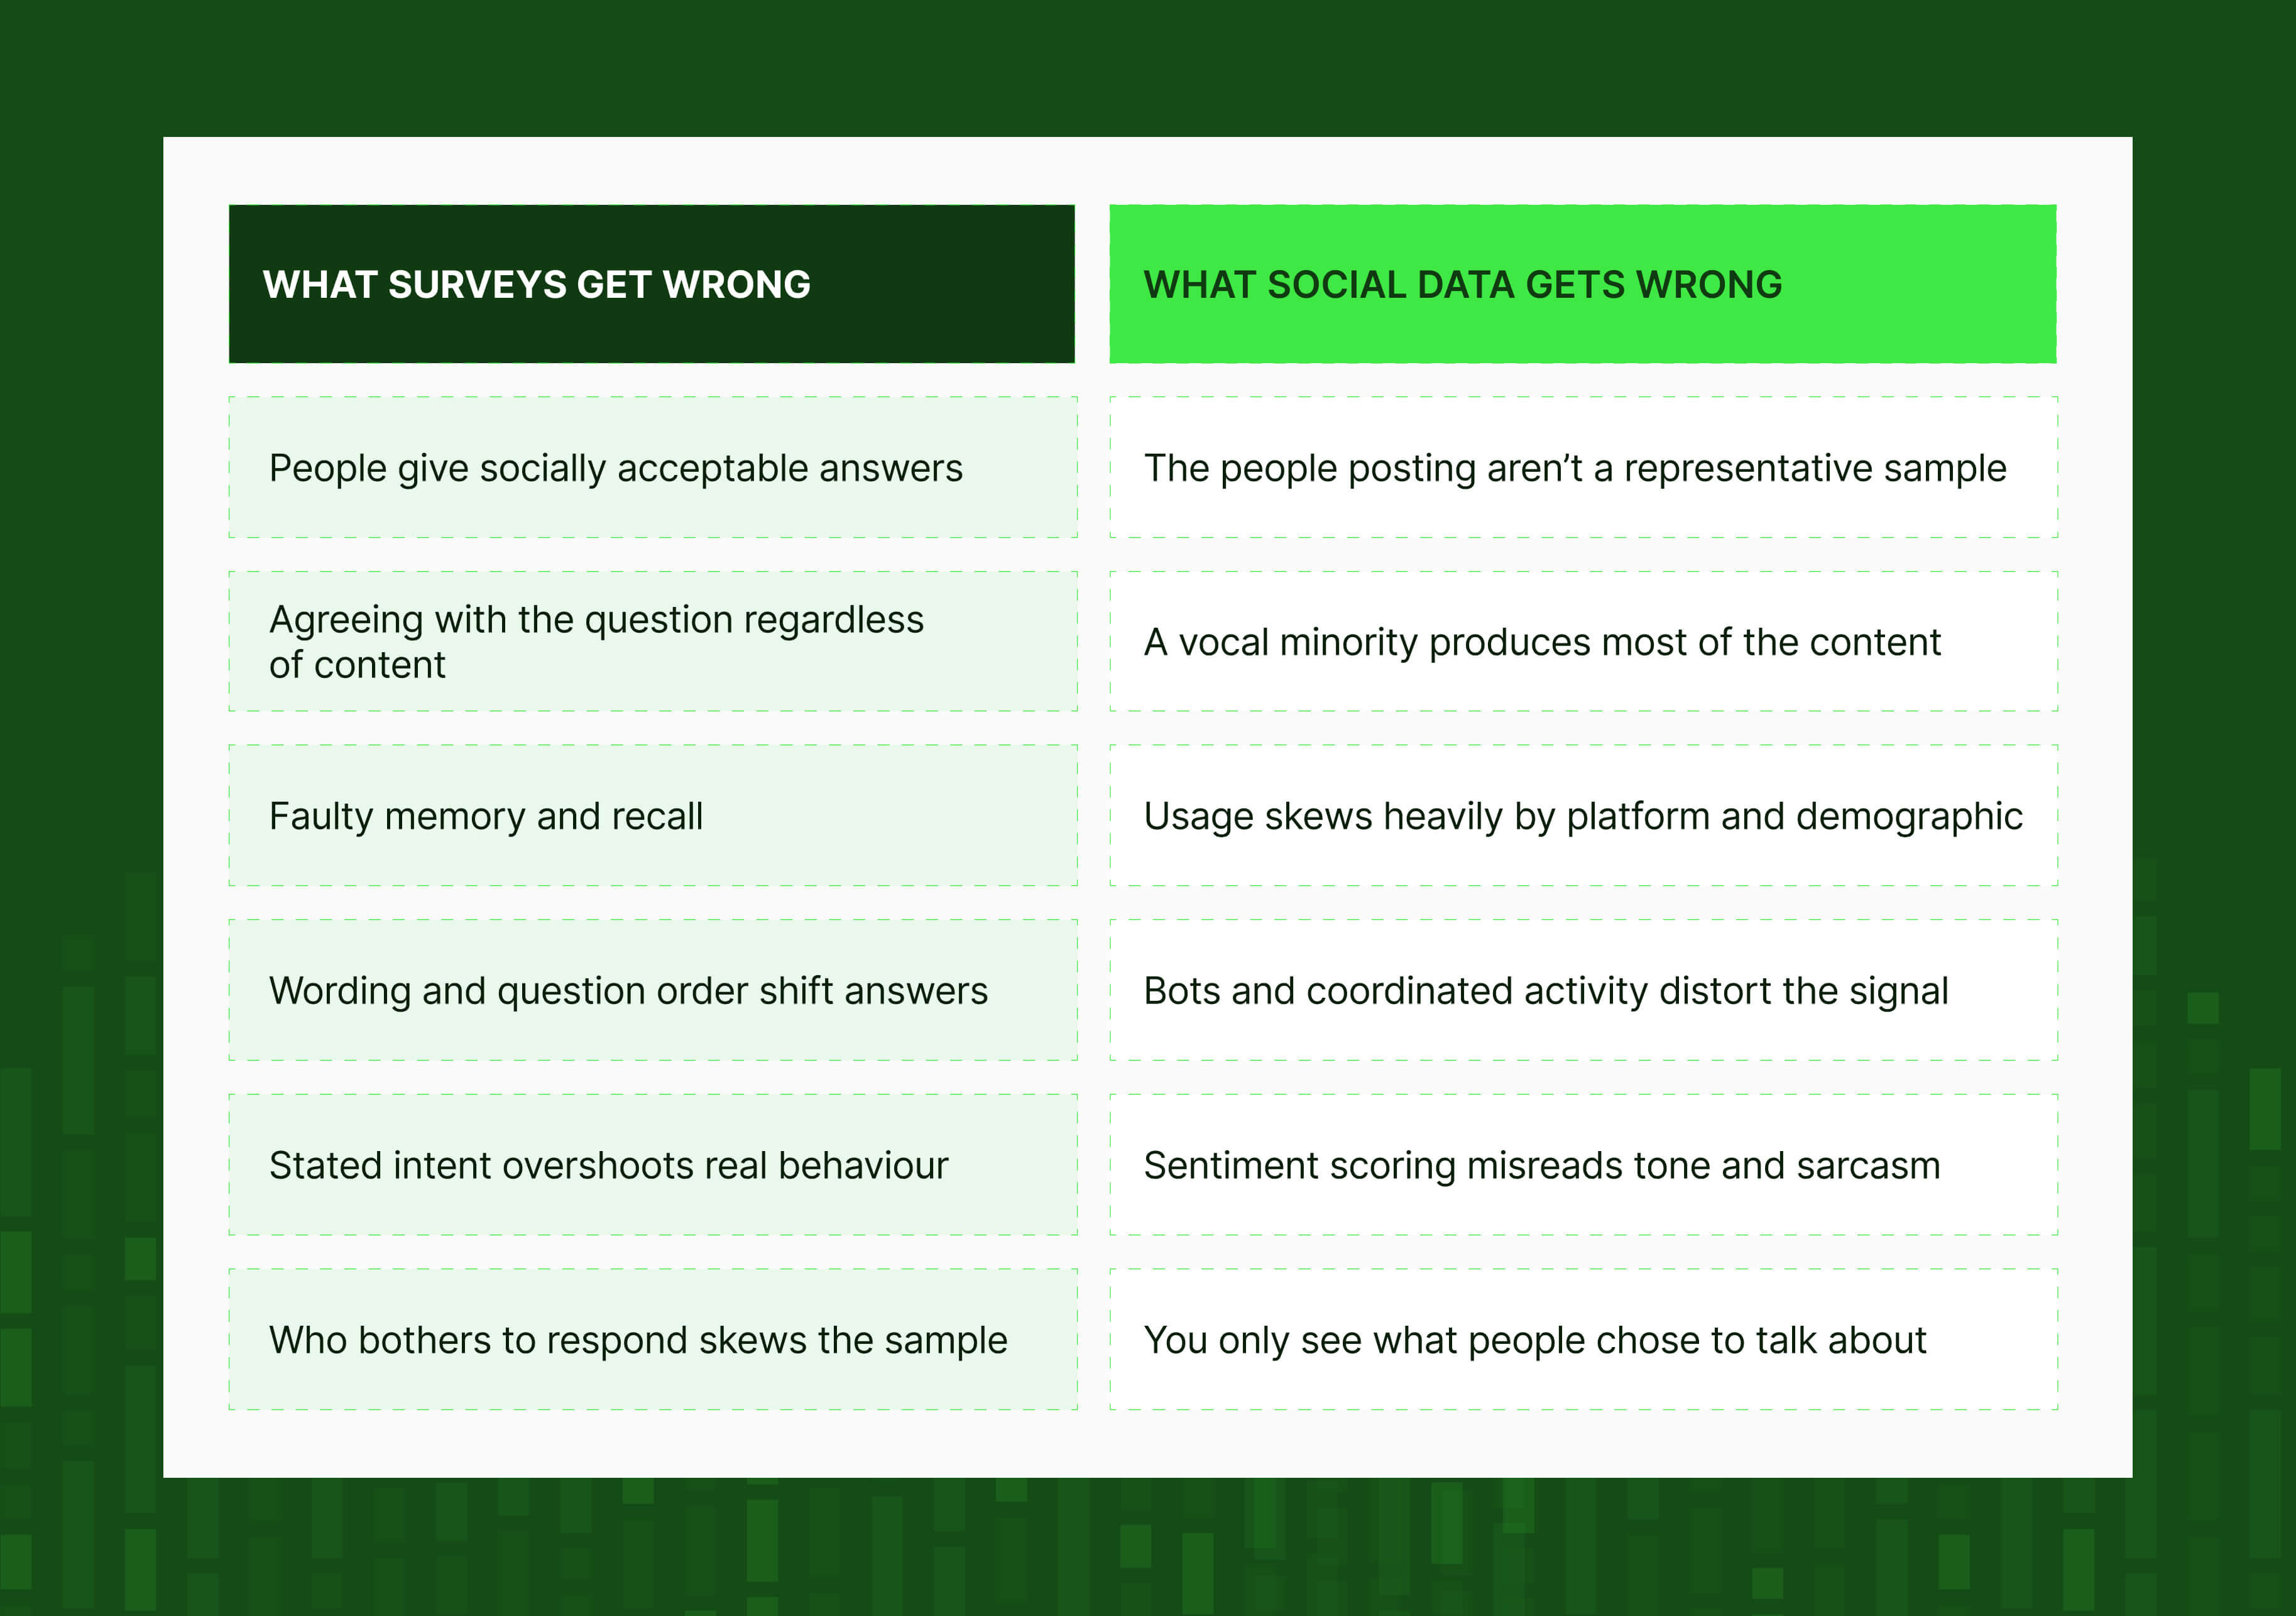
That's what makes combining them worth the effort. If a finding shows up in your survey and in the organic data, it has cleared two sets of obstacles that trip up different things. So it's far less likely to be an artefact of how you measured it.
And when the two disagree, that's not a failure; it's a signal telling you exactly where to look next.
4 ways market research teams use social data to validate surveys
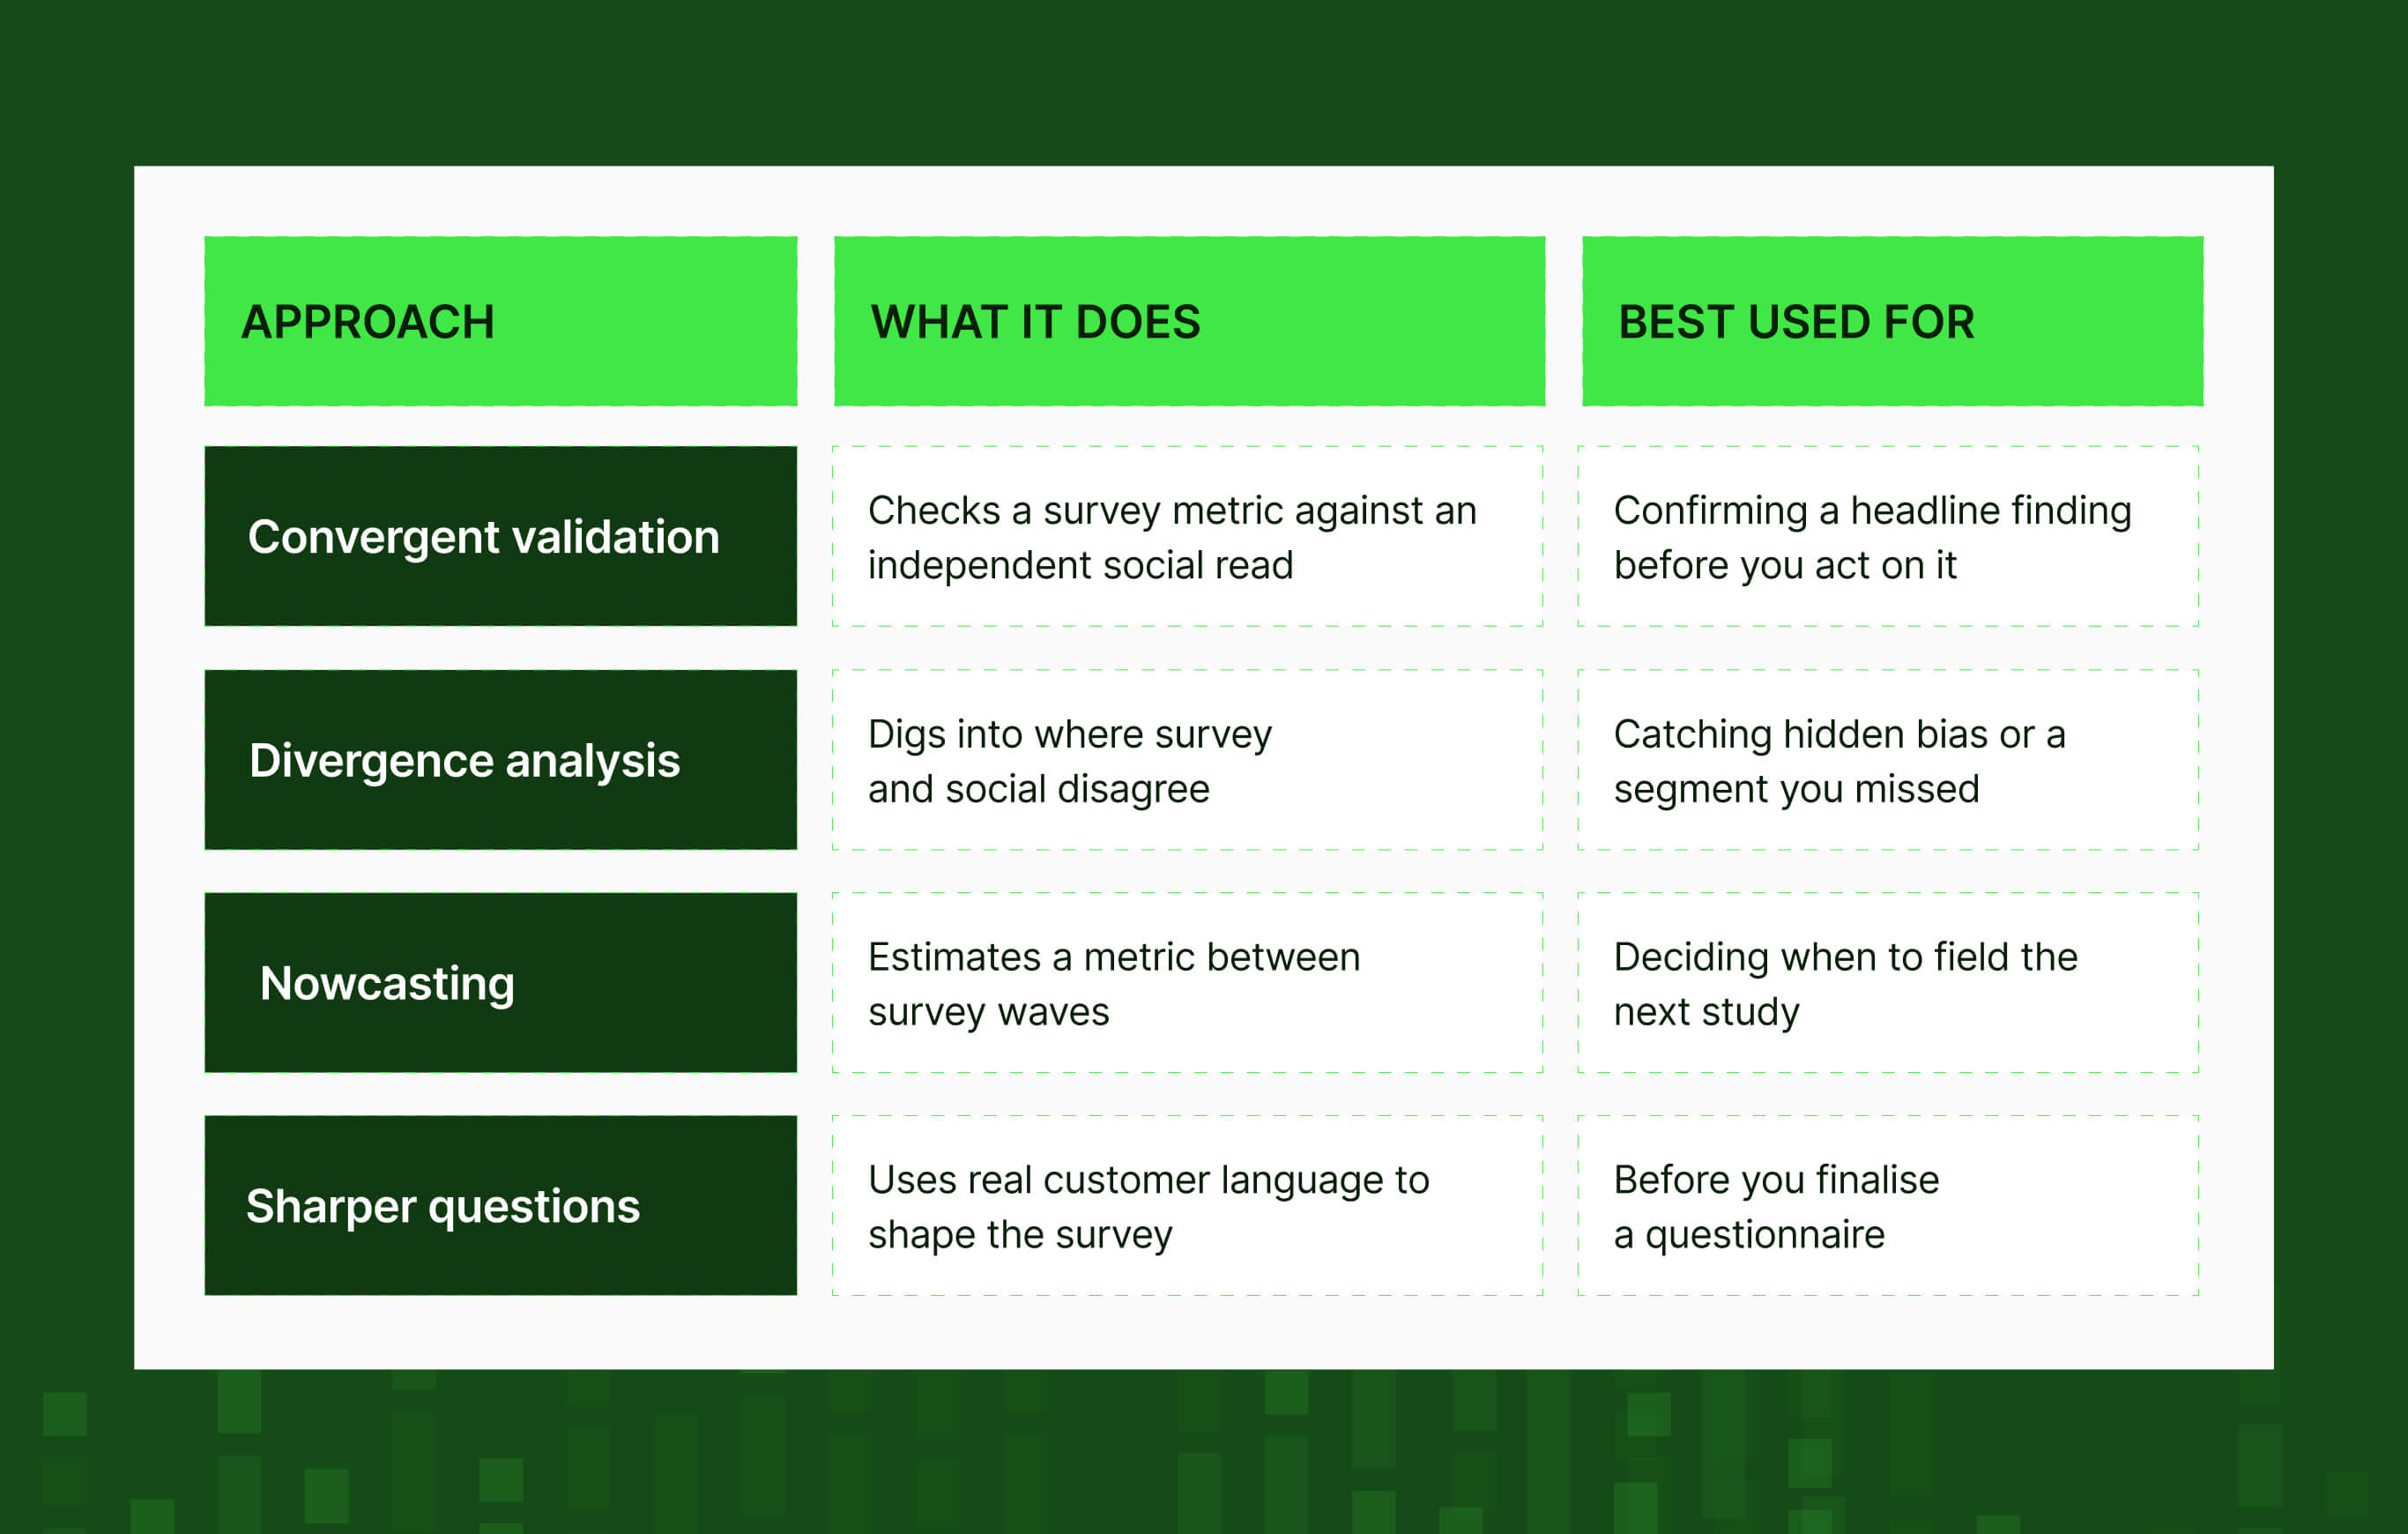
Market research teams can put social data to work against a survey in four main ways:
1. Convergent validation
Convergent validation is simple: you take a survey finding and check whether an independent source tells the same story.
What is convergent validation?
Say your latest wave shows brand consideration up six points this quarter. On its own, that's a number you're hoping is real.
To pressure-test it, you look at organic conversation over the same window and ask whether it moved in the same direction: more people talking about the brand as an option, warmer sentiment, that kind of shift.
Define your social measure before you look
The one rule that makes or breaks this: decide what your social measure is before you look at the result.
It's easy, after the fact, to go hunting for any organic signal that happens to agree and call it confirmation. Defining the measure up front ("we'll track share of positive brand mentions") stops you from quietly reverse-engineering a match.
If the two line up, you've got a finding that showed up two independent ways, and you can put it in front of stakeholders with real confidence and a clear reason why.
If they don't, that's your cue to run divergence analysis (next) and work out which source is off.
2. Divergence analysis
Divergence analysis is the flip side of convergent validation: instead of celebrating when the two sources agree, you dig into what it means when they don't.
Why survey and social data diverge: 3 causes
It sounds like the disappointing outcome, but the disagreements are usually where the insight is. A match confirms what you already suspected; mismatch is telling you something you didn't know – that one of your sources is off, or that reality is more complicated than either number alone suggests.
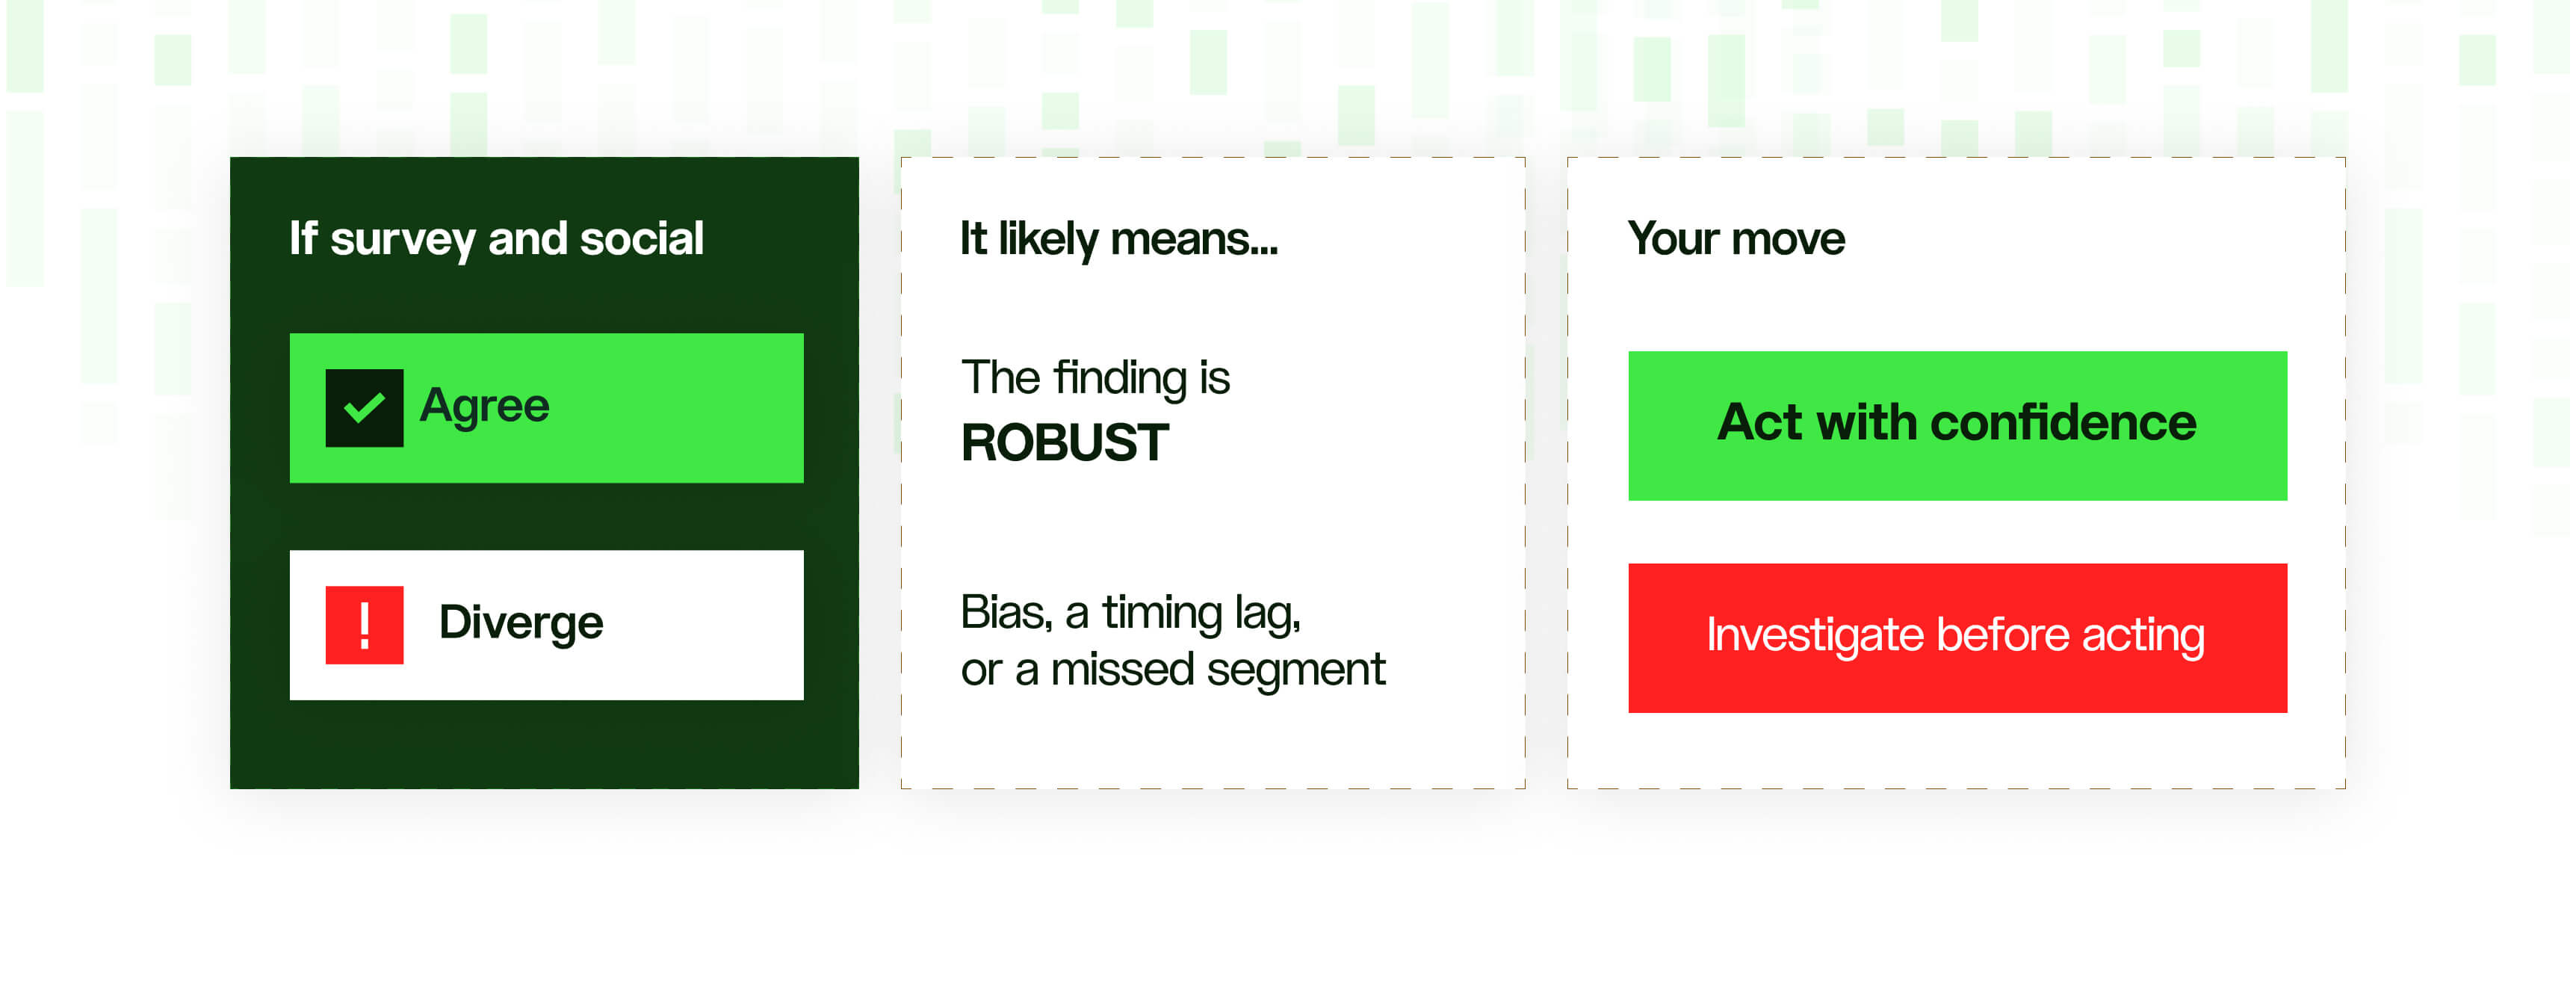
When the two pull apart, there are usually three suspects:
- Bias in the survey. The question may have nudged people toward a tidier answer than they'd give unprompted: social desirability, or wording that led the witness.
- A timing lag. Organic conversation often moves before a survey wave catches up, so a "disagreement" can just be the two sources reading different moments.
- A missed segment. The survey and the social data may be capturing different groups of people, and the gap is a real difference between them, not an error.
For more on reading early warning signs in review data, see how to spot customer churn signals in reviews.
3. Nowcasting between waves
What is nowcasting in market research?
Nowcasting means estimating where a metric stands right now, in the gaps between survey waves, using a faster-moving signal to fill in the blanks.
The problem it solves is timing. Surveys arrive on a schedule (quarterly, twice a year, whenever the budget allows) but the thing you're measuring doesn't wait for your next wave.
A reputation shift, a pricing backlash, a competitor's misstep: all of it can happen in week two of a twelve-week gap, and your tracker won't see it until it's old news.
What nowcasting gives your team
Organic conversation doesn't run on that schedule. It moves in close to real time, and it often moves before a survey catches up. That gives teams two things:
- A read between waves. You can estimate where a metric is heading without waiting for the next study to confirm it.
- Better timing for the next study. If the signal spikes, that's your cue to get a wave in the field while it matters, rather than fielding on autopilot.
Validate the lead-lag relationship out of sample
One rule keeps this honest: test the lead-lag relationship on data you didn't use to build it. It's easy to look back, notice that social moved a few weeks ahead of your survey last year, and assume it always will. Sometimes that relationship is real and repeats; sometimes it's a coincidence that falls apart the moment you rely on it. Checking it against a fresh stretch of data is what separates a genuine leading indicator from a pattern you talked yourself into.
4. Sharper survey questions
Before you finalise a questionnaire, read how customers describe things in their own words.
You'll pick up the vocabulary they use, the concerns you didn't think to ask about, and the answer options you were about to leave off. That strips framing bias out of the survey before it ever goes out.
Why survey bias starts with question design
The majority of survey bias is baked in at the writing stage. You can only ask about what you already think matters, in words you already use, with answer options you thought of in advance.
If your assumptions are slightly off, the survey quietly inherits them – and no amount of clean fieldwork fixes a question that was framed wrong to begin with.
3 ways customer language improves your survey
Reading organic conversation first closes that gap. Spend time in how customers describe the thing in their own words and you come away with three upgrades to the questionnaire:
- Their vocabulary, not yours. People answer more honestly when a question sounds like how they actually think about the topic, rather than internal jargon or marketing language.
- Concerns you didn't know to ask about. The issues that dominate real conversation are often ones that never made it onto your draft.
- Answer options you were about to leave off. The choices people bring up unprompted become response options, so respondents aren't forced to pick the closest-but-wrong answer.
This is part of a bigger move toward mapping the full customer voice by combining social and review data.
How to stress-test survey findings with social data (step by step)
- Start with the finding you want to check. Pick one specific survey metric and the window it covers.
- Define an independent social measure of the same thing before you look. Decide up front what organic signal stands in for that metric, so you can't bend it to fit.
- Align the time frames. Compare the same period on both sides.
- Compare direction first, then size. Are they moving the same way? By roughly how much?
- Read the result. Agreement is added confidence. Divergence is a lead; work out whether it's bias, timing, or a segment the survey missed.
How to tell if your survey and social data agree
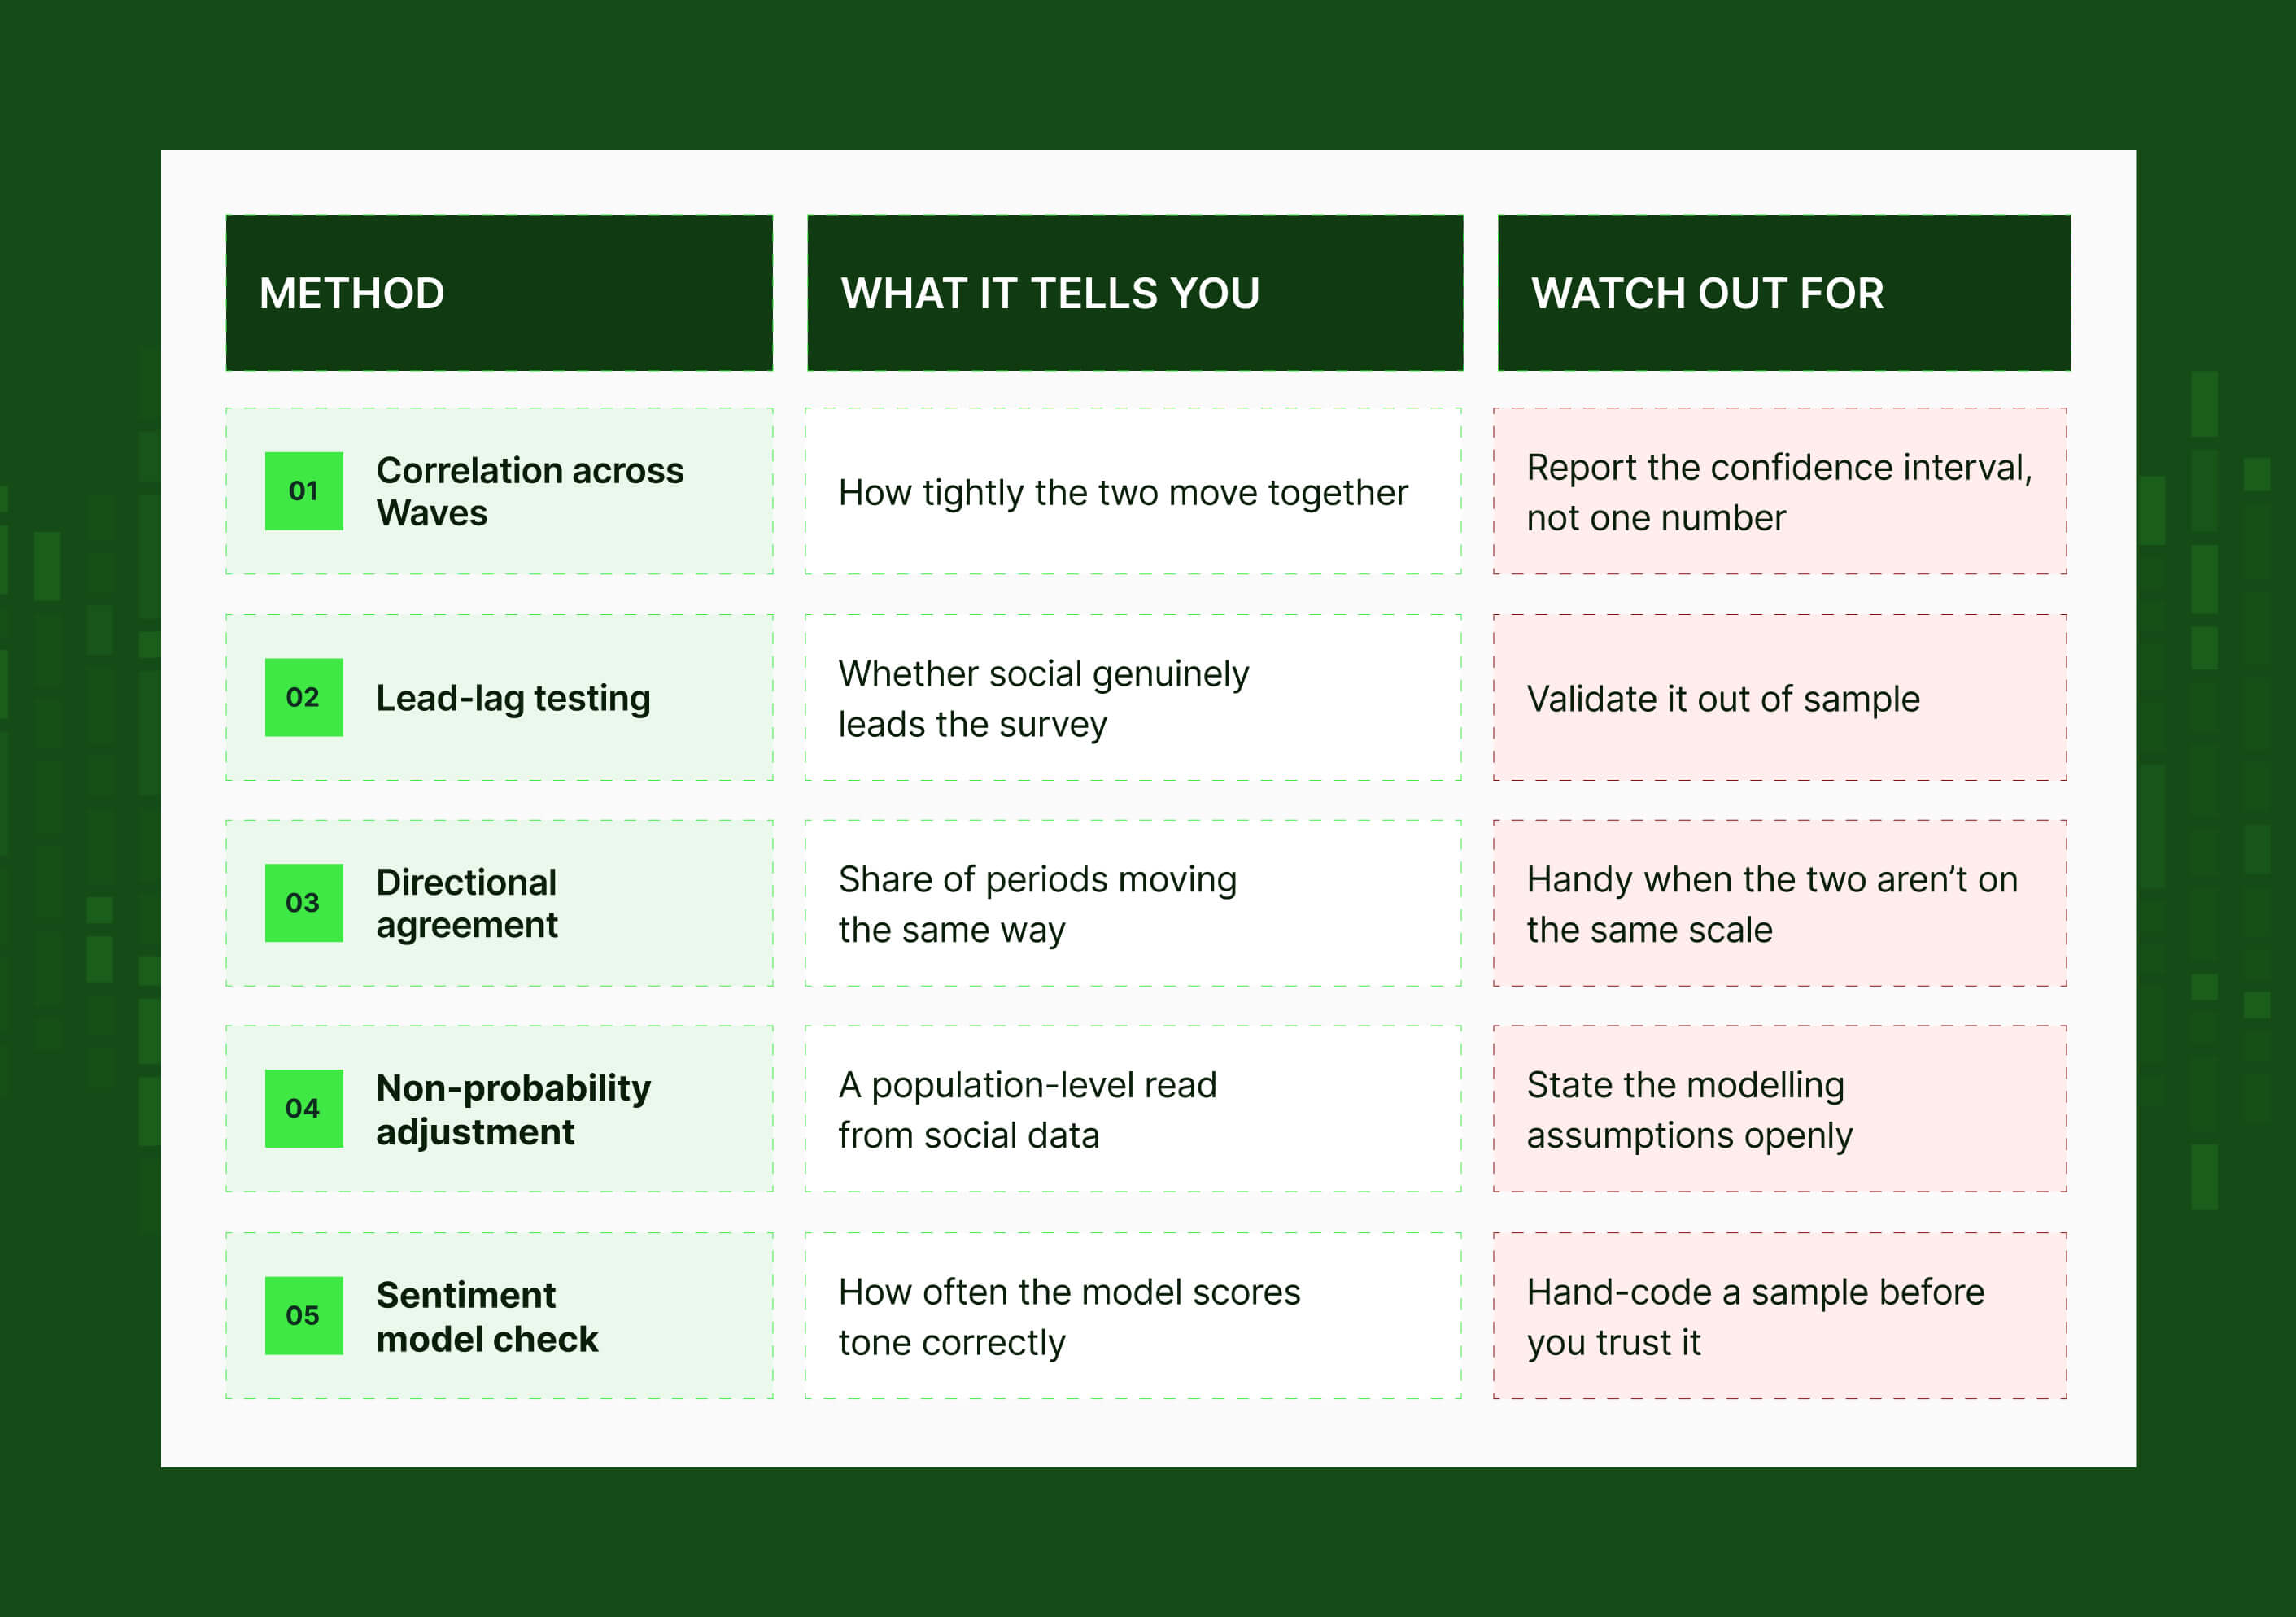
Correlation across waves
Line up your survey metric and your social metric over several waves and measure how tightly they move together.
A strong correlation means that when one rises or falls, the other tends to follow – the basic evidence that they're tracking the same underlying thing.
The catch is that a single correlation number hides how much uncertainty sits behind it, especially with only a handful of waves. Report the confidence interval alongside it, so you're honest about how firm the relationship really is.
Lead-lag testing
Sometimes social doesn't just agree with the survey, it moves first.
Lead-lag testing checks whether that's genuinely happening and, if so, by how long.
But a lead you spotted in last year's data is a hypothesis, not a fact. Validate it out of sample (on a stretch of data you didn't use to find the pattern) before you trust it to predict anything.
Directional agreement
When your survey and social metrics aren't on the same scale – a 0–100 satisfaction score against a share-of-positive-mentions figure, say – a correlation can be awkward to interpret.
Directional agreement sidesteps that by asking a simpler question: in what share of periods did both move the same way, up or down? It's less precise than correlation, but it's easy to explain and hard to argue with, which makes it a useful first check.
Non-probability adjustment
Social data has no defined population behind it, so you can't read a raw social number as "X% of customers."
Non-probability adjustment – weighting or modelling techniques like poststratification – is how teams produce a population-level estimate anyway.
It can work, but every one of those estimates leans on assumptions about who's represented and how. State those assumptions openly; a population figure that hides its modelling is where overclaiming creeps in.
Sentiment model check
Most of this rests on sentiment scoring being roughly right, and sentiment models still misread sarcasm, negation, and industry-specific language.
Before you trust an aggregate sentiment reading as one side of your comparison, hand-code a sample of posts yourself and check how often the model agrees with a human.
If it's wrong a third of the time, you're comparing your survey to the model's mistakes.
Sentiment is a starting point, not a conclusion. More on that in why sentiment alone isn't a strategy.
What about synthetic (AI) respondents?
There's a newer shortcut on the table: using AI to simulate respondents instead of collecting more real ones.
What synthetic respondents are
Instead of recruiting and surveying more real people, you prompt a large language model to answer as if it were a respondent: often conditioned on real demographic profiles so the simulated answers mirror how an actual sample might respond.
The research behind it, simulating human samples with language models, is interesting, and for some jobs (pre-testing a questionnaire, sketching likely responses before you field, filling small gaps) it can save real time and money.
Why AI can't stress-test a survey
Stress-testing works because your second source fails in different ways from your survey. A synthetic respondent breaks that.
- It learned from the same kind of data. A model trained to imitate survey answers absorbs the patterns, and the biases, already present in survey responses. Ask it to check your survey and you're largely asking the biases to confirm themselves.
- It generates no new behaviour. There's no independent, real-world signal in a synthetic answer. Nothing happened outside your study that the model can report back. It's a very sophisticated echo, not a second witness.
So a synthetic respondent can agree with your survey convincingly and still be wrong in exactly the same direction your survey was.
Where organic social data is different
Organic conversation clears that bar because it comes from real people doing real things, generated with no connection to your study.
It carries its own flaws, but they're different flaws, which is the property that makes a second source worth having.
Representativeness is the caveat – here's a framework for evaluating whether your social data covers who you think it does.
How to use social data responsibly
- Be upfront that social data is non-representative, and say who it does and doesn't cover
- Report the error in your sentiment model rather than presenting its output as exact
- Frame conclusions as corroboration or divergence, not proof
- Resist overclaiming. The strength here is method independence, not a promise that one source is truer than the other
If you're working through the compliance side, our GDPR guide for SaaS teams goes deeper.
Takeaways
- Surveys and social data fail differently, which is exactly what makes them a good pair
- Agreement builds confidence; disagreement is a lead – often the more useful of the two
- Four core moves: convergent validation, divergence analysis, nowcasting, and sharper questions
- Do the maths. Correlation, lead-lag, and directional agreement turn "they roughly match" into something defensible
- Stay honest about the limits. Social data is a strong companion signal and a weak standalone predictor
Surveys tell you what people say. Social data shows you what they say when no one's asking.
💡 A survey you can't check is a finding you're taking on faith. Datashake puts structured social and review data behind a single API, so a second opinion is always one query away.
Frequently asked questions
Can social data validate survey results?
Yes, social data can corroborate or challenge survey results. Agreement between two methods with different biases raises your confidence; disagreement points to something worth investigating. Because social data isn't a probability sample, it supports surveys rather than replacing them.
Why do survey results sometimes contradict social sentiment?
Because they measure different things. Surveys capture prompted answers from a defined sample; social data captures unprompted expression from a self-selected, vocal subset. A contradiction usually signals bias in one source, a timing gap, or a real difference between segments.
Is social media data representative of the general population?
Social media data has no defined population behind it and skews by platform and by who chooses to post. Use it for direction, theme discovery, and corroboration, and treat any population-level claim as model-based.
What is triangulation in market research?
Triangulation is the practice of using more than one independent source or method to test whether a finding holds up. Pairing surveys with organic social data is a textbook example.
What is nowcasting in market research?
Nowcasting is estimating where a metric stands right now, between survey waves, using a faster-moving signal, validated on data you didn't use to build it.
.png)



More insights you might like


