Brandwatch vs. Sprinklr vs. Building Your Own Data Pipeline
.jpg)
Short answer: Brandwatch vs. Sprinklr vs. build your own data pipeline:
- Brandwatch: roughly $30K–$150K+/year; suits marketing teams that want a listening dashboard with publishing built in.
- Sprinklr: now enterprise-only, starting around $50K/year; fits large orgs unifying social media management with contact center and CX.
- Build it yourself: looks free right up until it costs $4.19M–$7.93M over three years
- The fourth option: buy the raw data as infrastructure (it's what Datashake does, across 150+ social media and review sources) and keep the intelligence and the decisions in-house.
Buy Brandwatch, buy Sprinklr, or build your own social listening pipeline? Pretty much every team that starts shopping for social and review data ends up having this debate.
We'll give it to you straight: Brandwatch goes deeper on social listening and consumer research, Sprinklr is the one to run your customer experience stack – contact center, social, and marketing – from a single platform.
But those aren't the only two ways to get social media and review data. 👀
There are two more options, which we’ll be talking about today, with their realistic costs, trade-offs, and how to figure out which path works for what you're trying to do.
Let’s dive in.
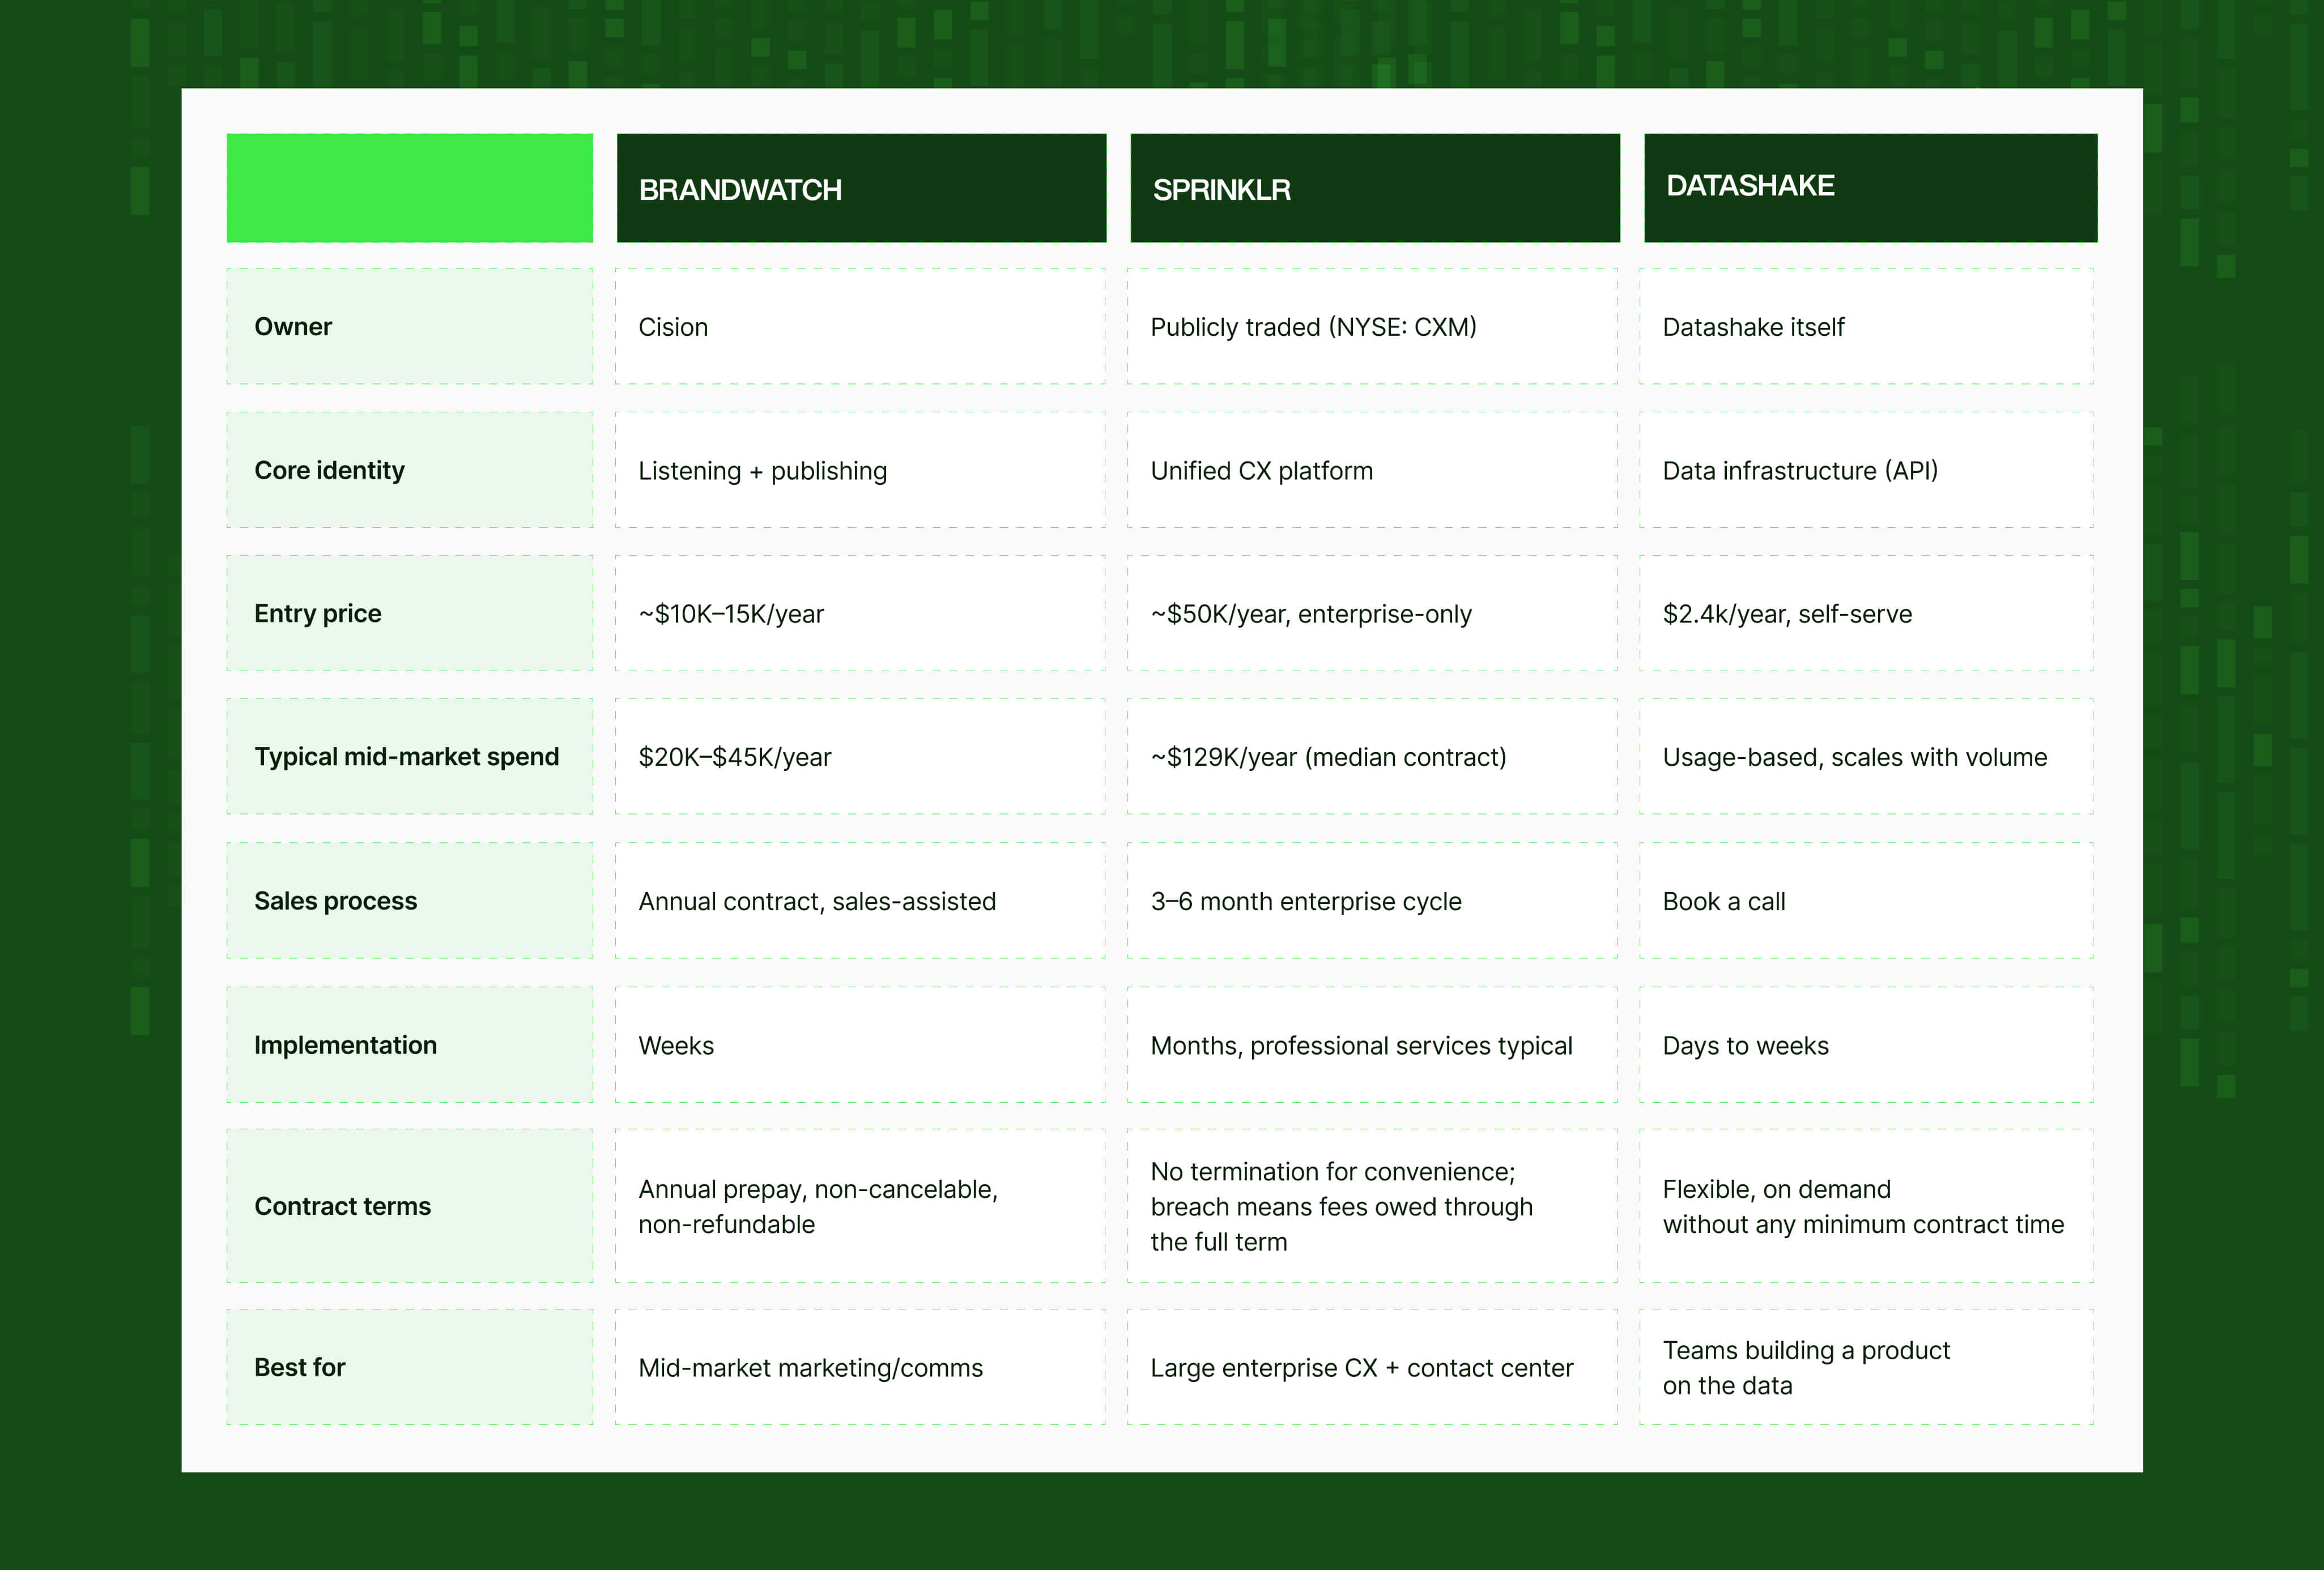
At a glance: Brandwatch vs. Sprinklr vs. build vs. buy
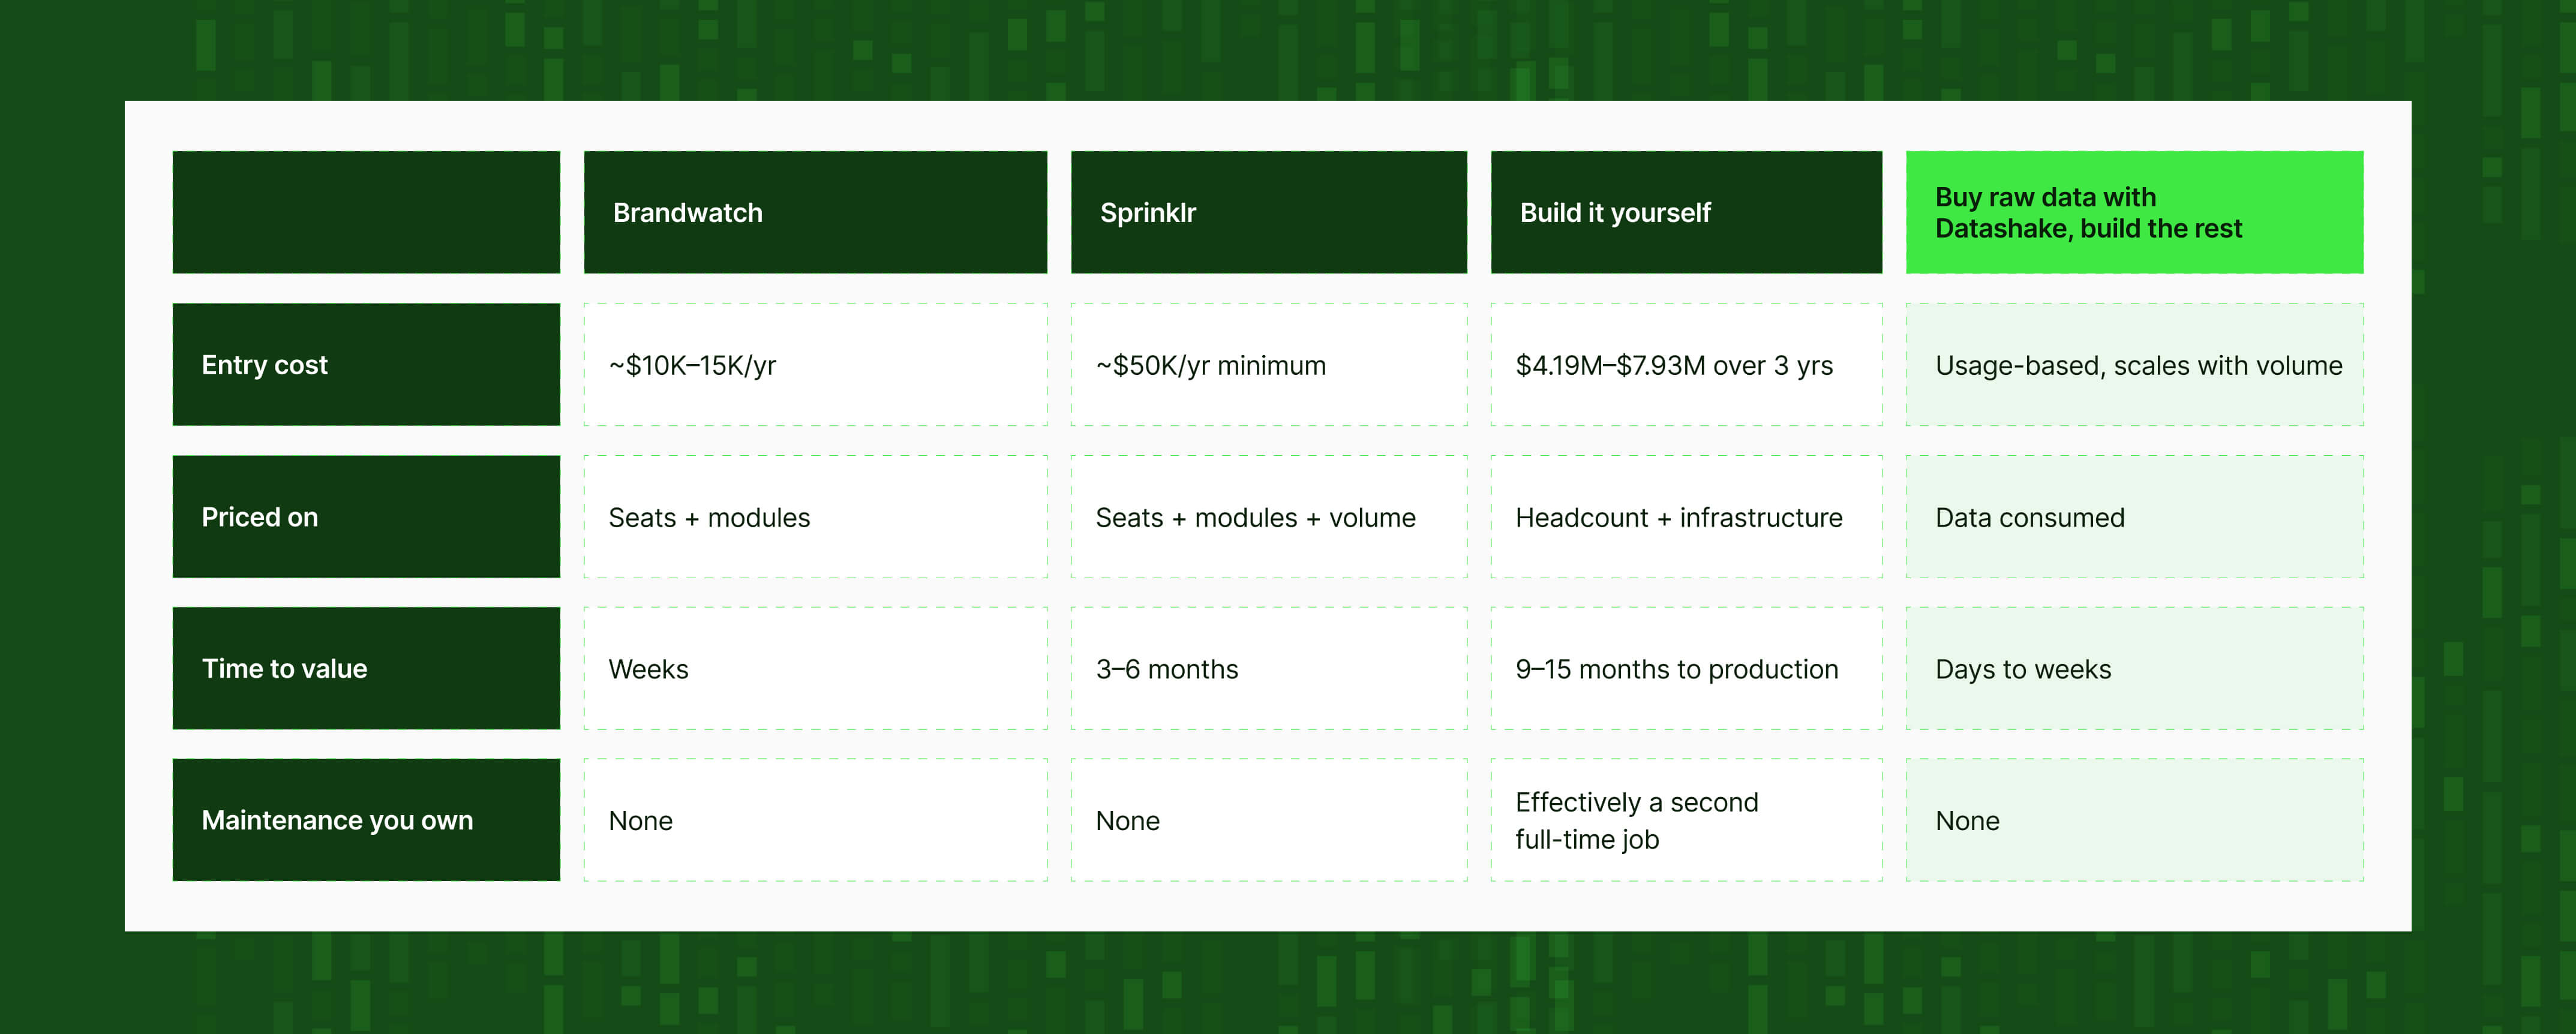
Teams building a product on top of the data + teams wanting to own intelligence + teams wanting to have full control how intelligence process in-house + teams wanting to blend intelligence, which normally are in silos/in (external) tools
Data, intelligence, workflow: what you're really paying for
Social listening is the process of tracking and analyzing conversations about a brand, competitor or topic across social media, review sites, and forums – used to monitor sentiment, spot trends, and understand what customers and competitors' customers are saying.
Brandwatch and Sprinklr are both, at their core, social intelligence & tools with extra layers. So is building your own. The question is which layers you need to own.
Any social listening setup is really five layers stacked on top of each other:
- Aggregation – who's collecting mentions, reviews, and posts, from how many sources, and how far back
- Enrichment – who's tagging that raw data with sentiment, language, and other metadata
- Analysis – who's turning enriched data into trends, alerts, and other insights
- Visualization – who's deciding how any of that actually gets shown to you: charts, feeds, exports
- Workflow – who's giving your team seats, an inbox, and a publishing calendar
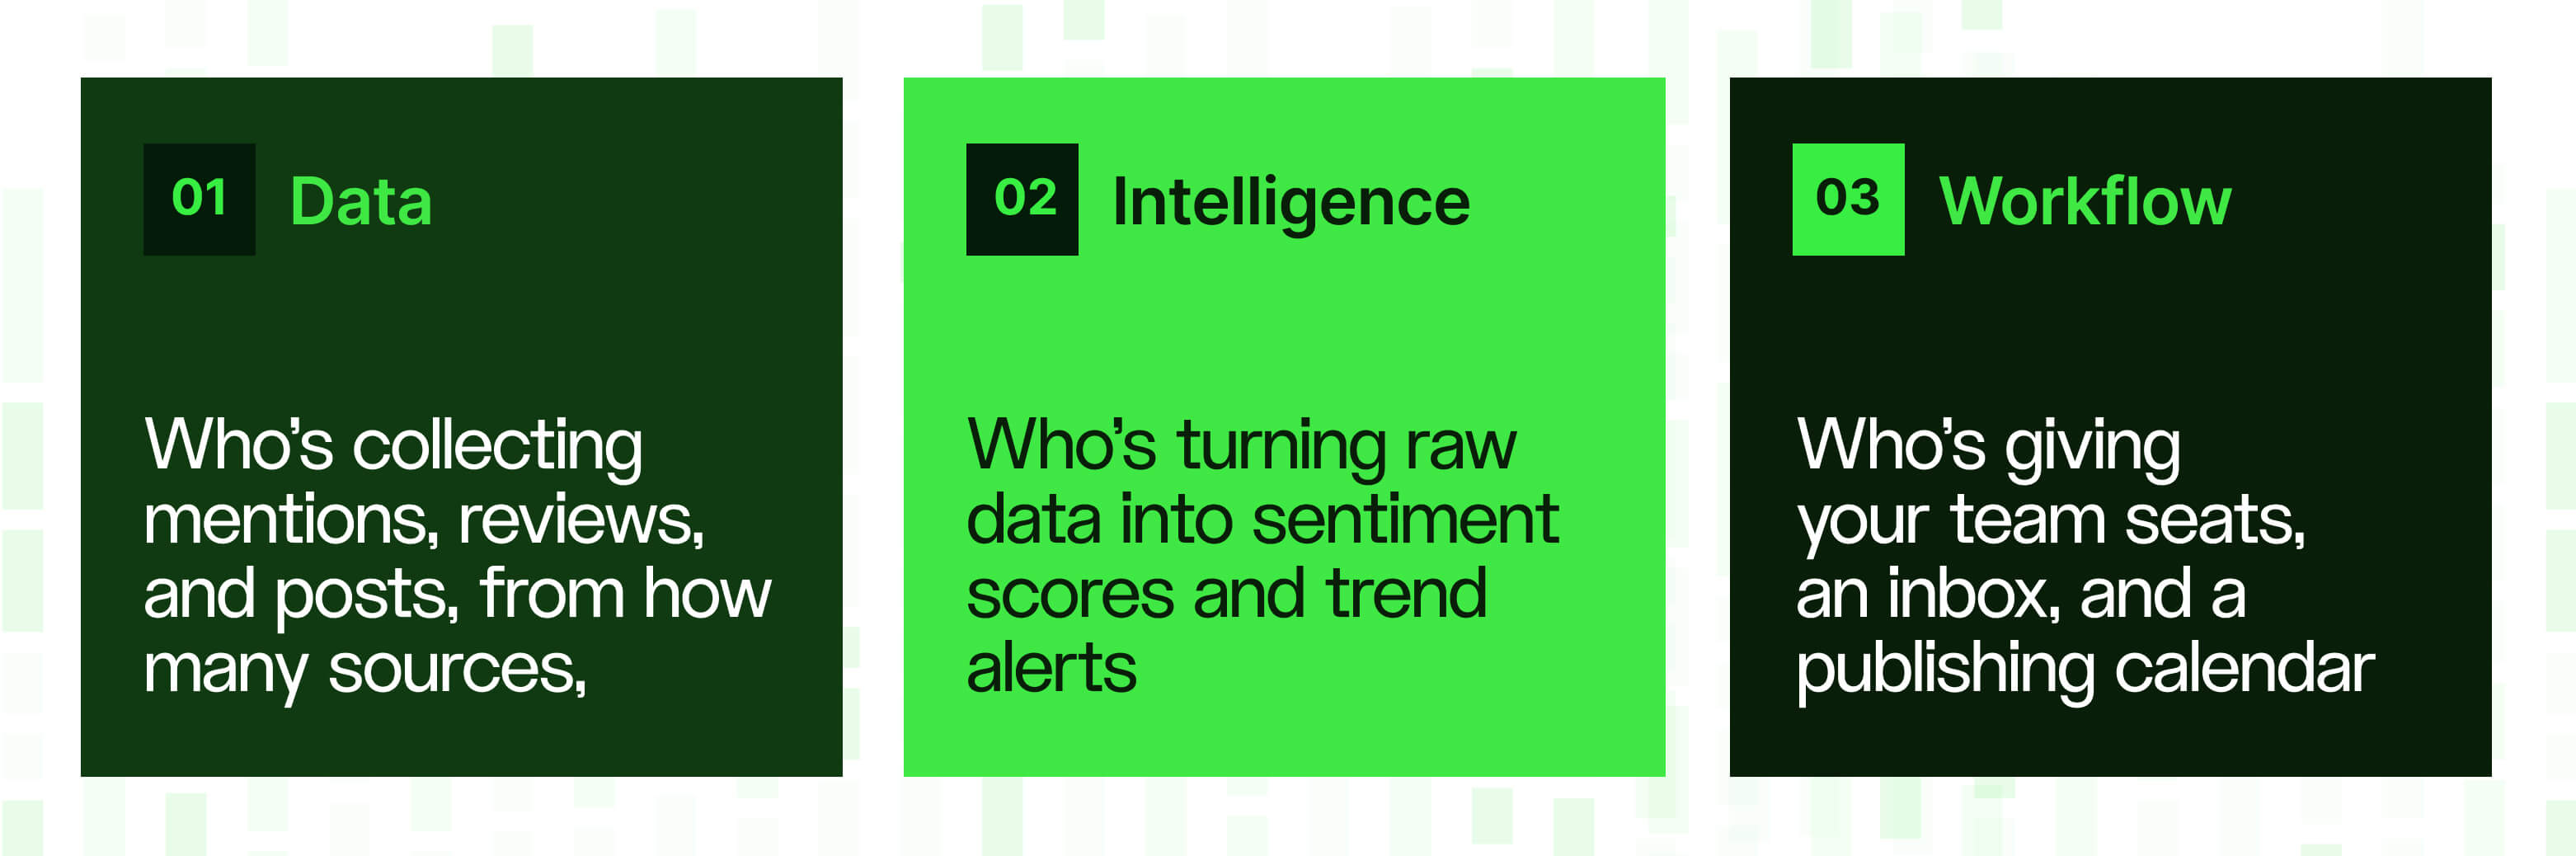
Brandwatch and Sprinklr both sell all five layers bundled together, priced as one contract. Nothing stops you from pulling data through their API and ignoring the dashboard, the seats, and the rest; but you're still billed for all five layers whether you touch them or not, because neither one prices the data layer on its own.
Build it yourself, and you land on the opposite extreme: you own all three, from building & maintaing multiple scrapers that pull data into the platform your team logs into every day, along with every hour of upkeep that comes with owning all three at once.
But there’s an option in between: buy the data layer on its own, then build or buy the intelligence and workflow layers separately.
➡️ Collect data from each social media platform's API (as you get with Sprinklr and Brandwatch), and you inherit every rate limit, sampling gap, and missing content category that API has, with nothing in place to compensate for it.
💡 Our mission at Datashake is to solve that upstream, at the aggregation layer: we collect and normalize data from 150+ social media platforms and review sites into one consistent format before it reaches you. That means every layer built on top of it (enrichment, analysis, visualization, workflow, whichever combination you choose) starts from data that's already been cleaned up.
We’ll talk about that later on, for now, let’s explore Brandwatch vs Sprinklr for social data.
Brandwatch review: pricing, pros, and cons (2026)

Brandwatch is a social listening and consumer intelligence platform, now owned by Cision, which acquired it in 2021.
It’s centered around three directions: Consumer Intelligence (the listening engine), Social Media Management (publishing and inbox), and an Influencer Marketing add-on.
Of the two major platforms, it's the one analysts tend to prefer for query-building and trend analysis. On Gartner Peer Insights, it currently sits at 4.7 stars across 25 reviews, slightly ahead of Sprinklr's 4.5 but across a much thinner review base.
The SI Lab's 2026 State of Social Intelligence report, a survey of 330 social intelligence professionals, ranked Brandwatch first 🥇and Sprinklr second 🥈across the tool landscape.
Brandwatch pricing in 2026
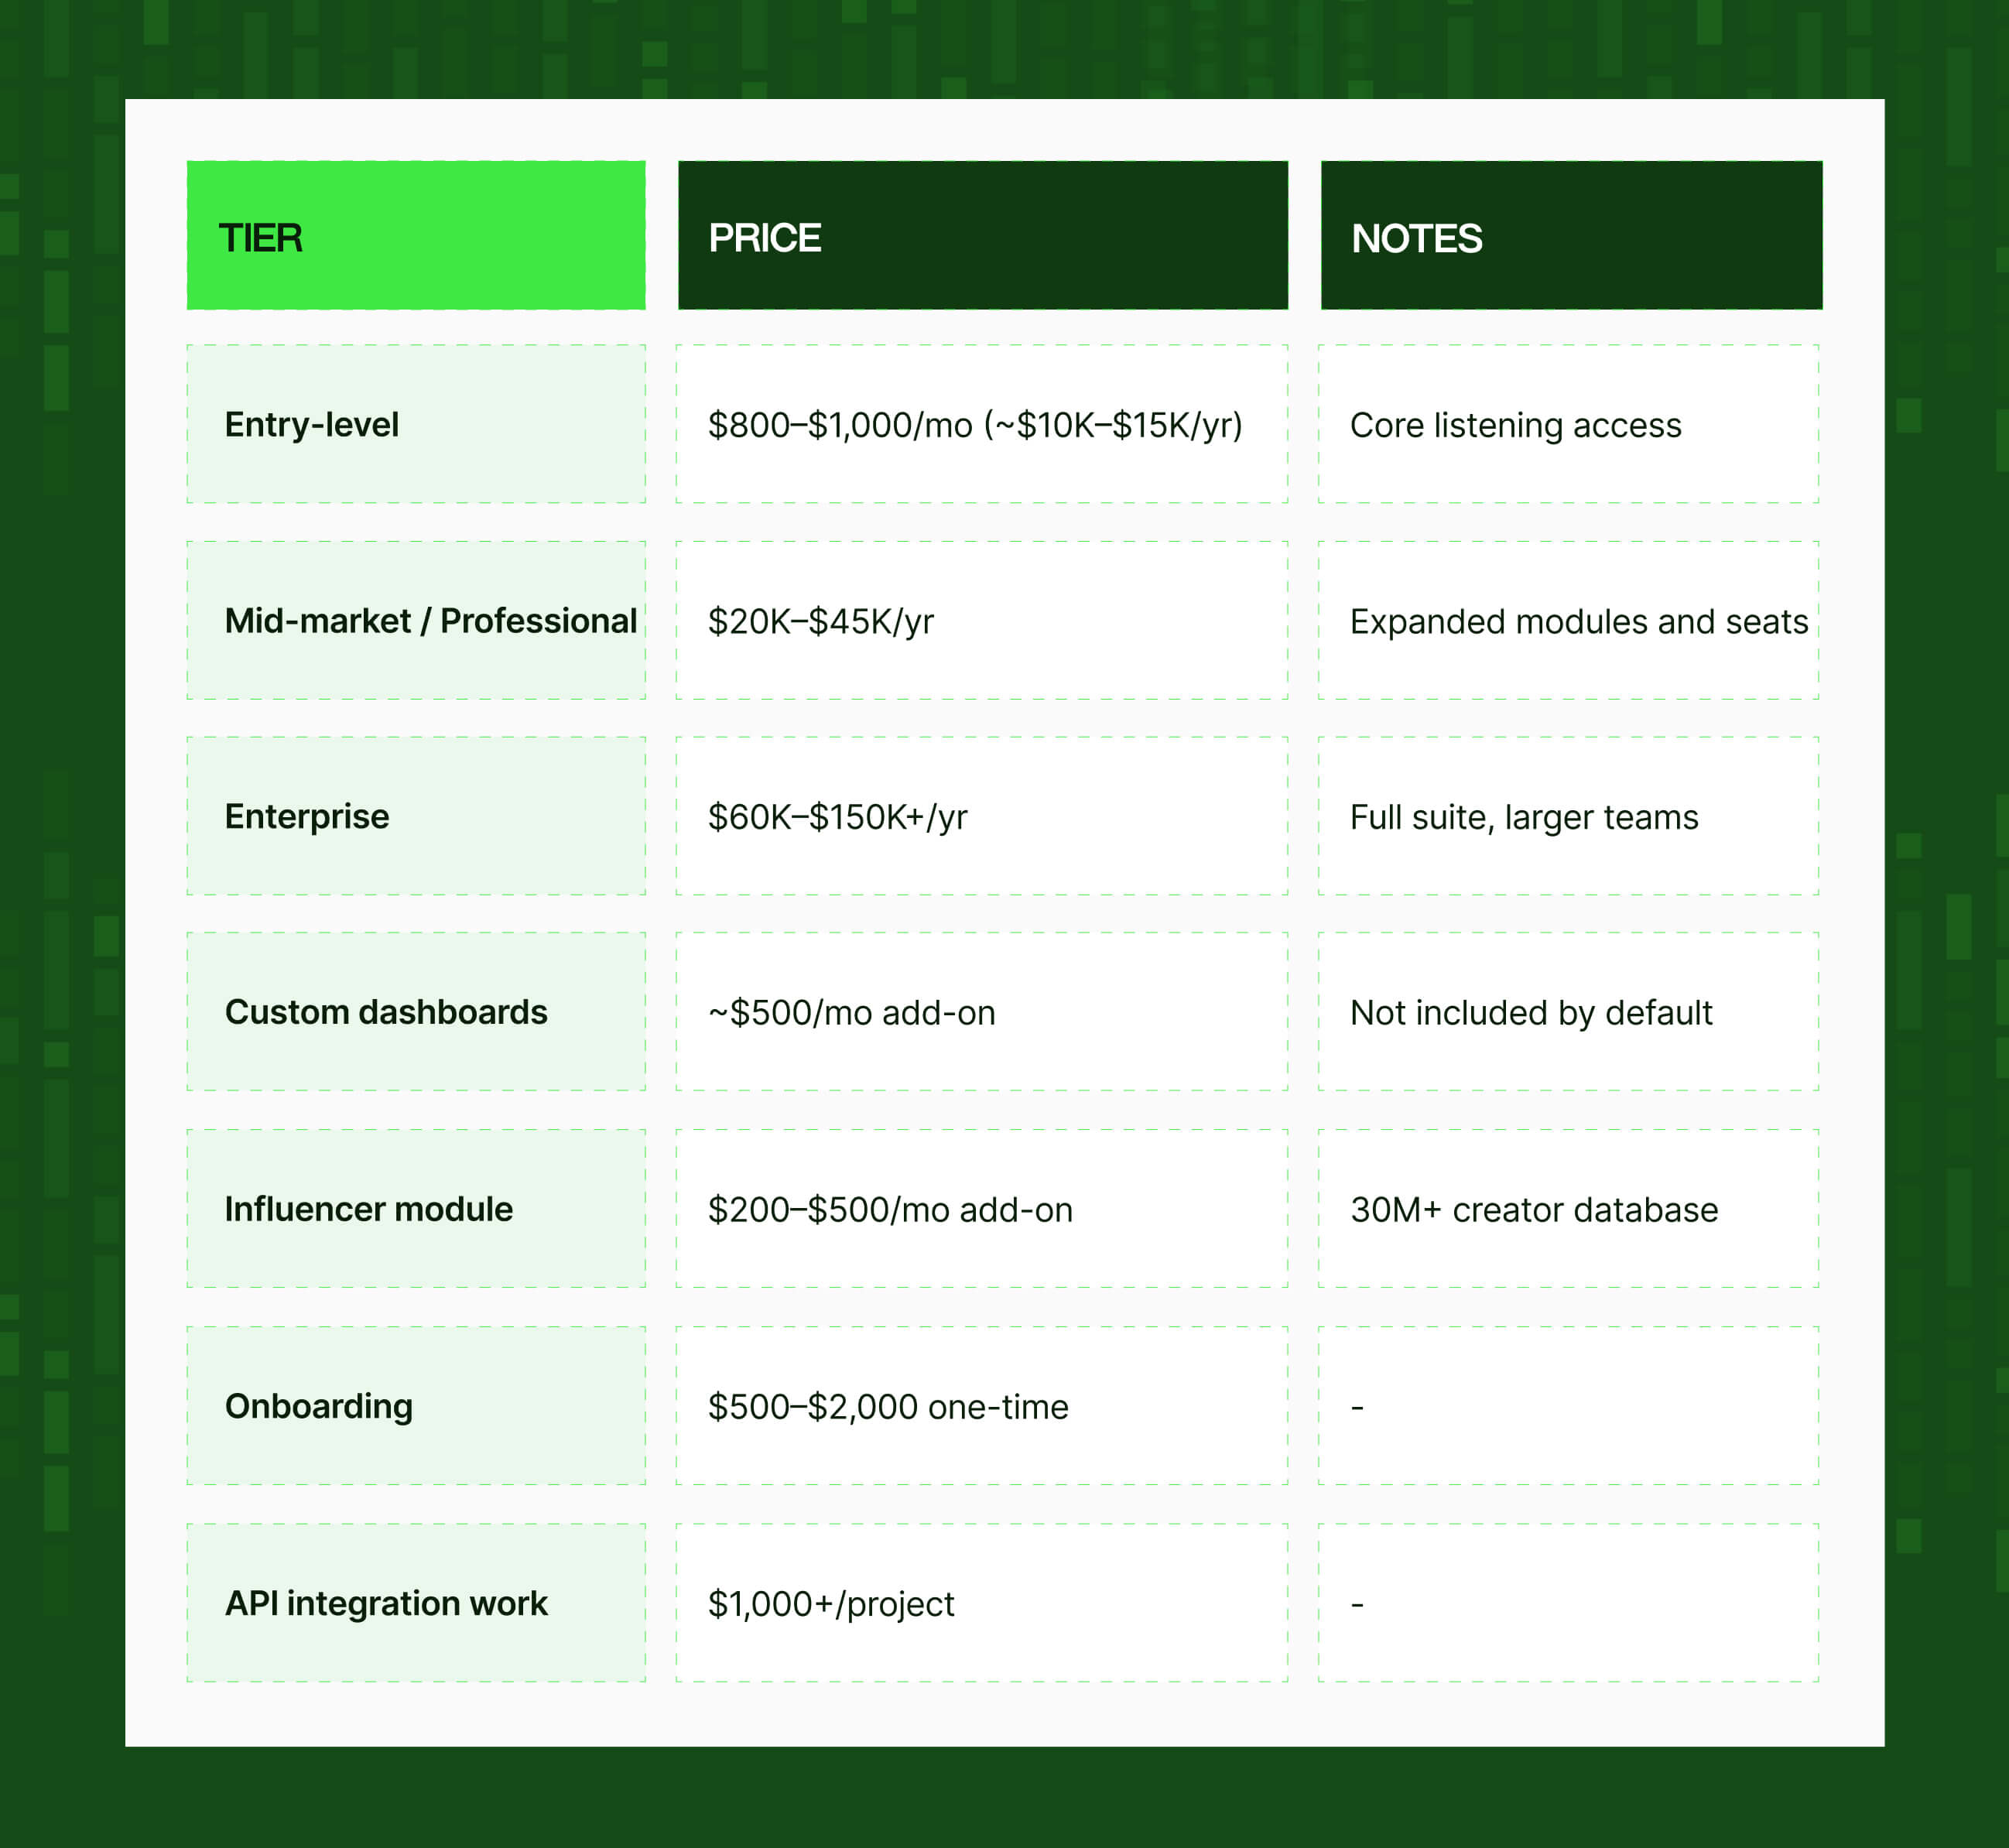
Brandwatch doesn't publish pricing anywhere, everything runs through a sales call and a 12-month contract. But based on buyer reports:
- Entry-level: $800–$1,000/mo (~$10K–$15K/yr) for core listening access
- Mid-market / Professional: $20K–$45K/yr for expanded modules and seats
- Enterprise: $60K–$150K+/yr for the full suite, and larger teams
- Custom dashboards: ~$500/mo add-on, they’re not included by default
- Influencer module: $200–$500/mo add-on with a 30M+ creator database
- Onboarding: $500–$2,000 one-time
- API integration work: $1,000+/project
✅ Brandwatch pros
- Managing multiple channels from one dashboard saves time, and reviewers describe the interface itself as intuitive and well laid out once you're past initial setup
- Search customization runs deep. Instead of one blunt keyword search, you get an extensive set of filters to isolate owned, earned, and shared mentions of your brand and competitors, so you're looking at what actually matters instead of every conversation that happens to contain your name.
- Broad source coverage with historical data reaching back to 2010 and Twitter firehose access
- Support is rated as responsive, and some enterprise accounts get a dedicated account manager
- They’re actively investing in AI features: a conversational assistant called Iris AI (2025–26) writes Boolean queries and summarizes dashboards in plain language, alongside expanded coverage of Threads, TikTok, and 70,000+ podcasts.
❌ Brandwatch cons
- Publishing reliability is a common complaint – scheduled posts that fail to go out, or reappear after they've been deleted. Publishing itself is also described as fairly basic, and several reviewers say they pair it with a dedicated scheduling tool rather than relying on it alone.
- No real cross-posting, so teams still copy-paste content between networks by hand.
- Sentiment accuracy gets mixed reviews. Some report trouble with sarcasm and nuance, and too much content landing in a catch-all "neutral" bucket. Test it against your own brand's tone during a trial rather than taking either claim at face value.
- A real learning curve – reviewers describe initial setup as "cumbersome," and SocialRails puts typical time-to-proficiency at one to three months, often needing a dedicated analyst to get full value out of the platform. Part of that friction is because Consumer Intelligence, Social Media Management, and Influence still run as three separate logins rather than one unified product.
- Coverage gaps show up despite the platform's overall breadth: reviewers on Capterra flag limited access to Instagram data beyond public posts, no LinkedIn DMs, and inconsistent TikTok depth
- Performance and export friction: multiple G2 reviewers describe slow loading on large datasets, occasional dashboard load failures, and limited export depth – PDF and PowerPoint exports are described as high-level overviews rather than full detail.
Who is Brandwatch best for?
Brandwatch is for mid-market and enterprise marketing or comms teams who:
- Want listening and publishing in one seat-based tool
- Don't mind a 12-month contract
- Would rather have a sharp, analyst-friendly query builder than a sprawling all-in-one CX suite
- Need real-time coverage for crisis management
Sprinklr review: pricing, pros, and cons (2026)

Sprinklr is a unified customer experience management (CXM) platform, the bigger, more ambitious of the two. It's not really sold as a listening tool anymore: it's five licensed modules (Service, Social, Insights, Marketing, Advertising) marketed as one system spanning contact center, social care, and marketing.
Sprinklr pricing in 2026
Sprinklr shut down its self-serve program on April 30, 2026, moving every deal onto an enterprise sales cycle that reportedly takes three to six months.
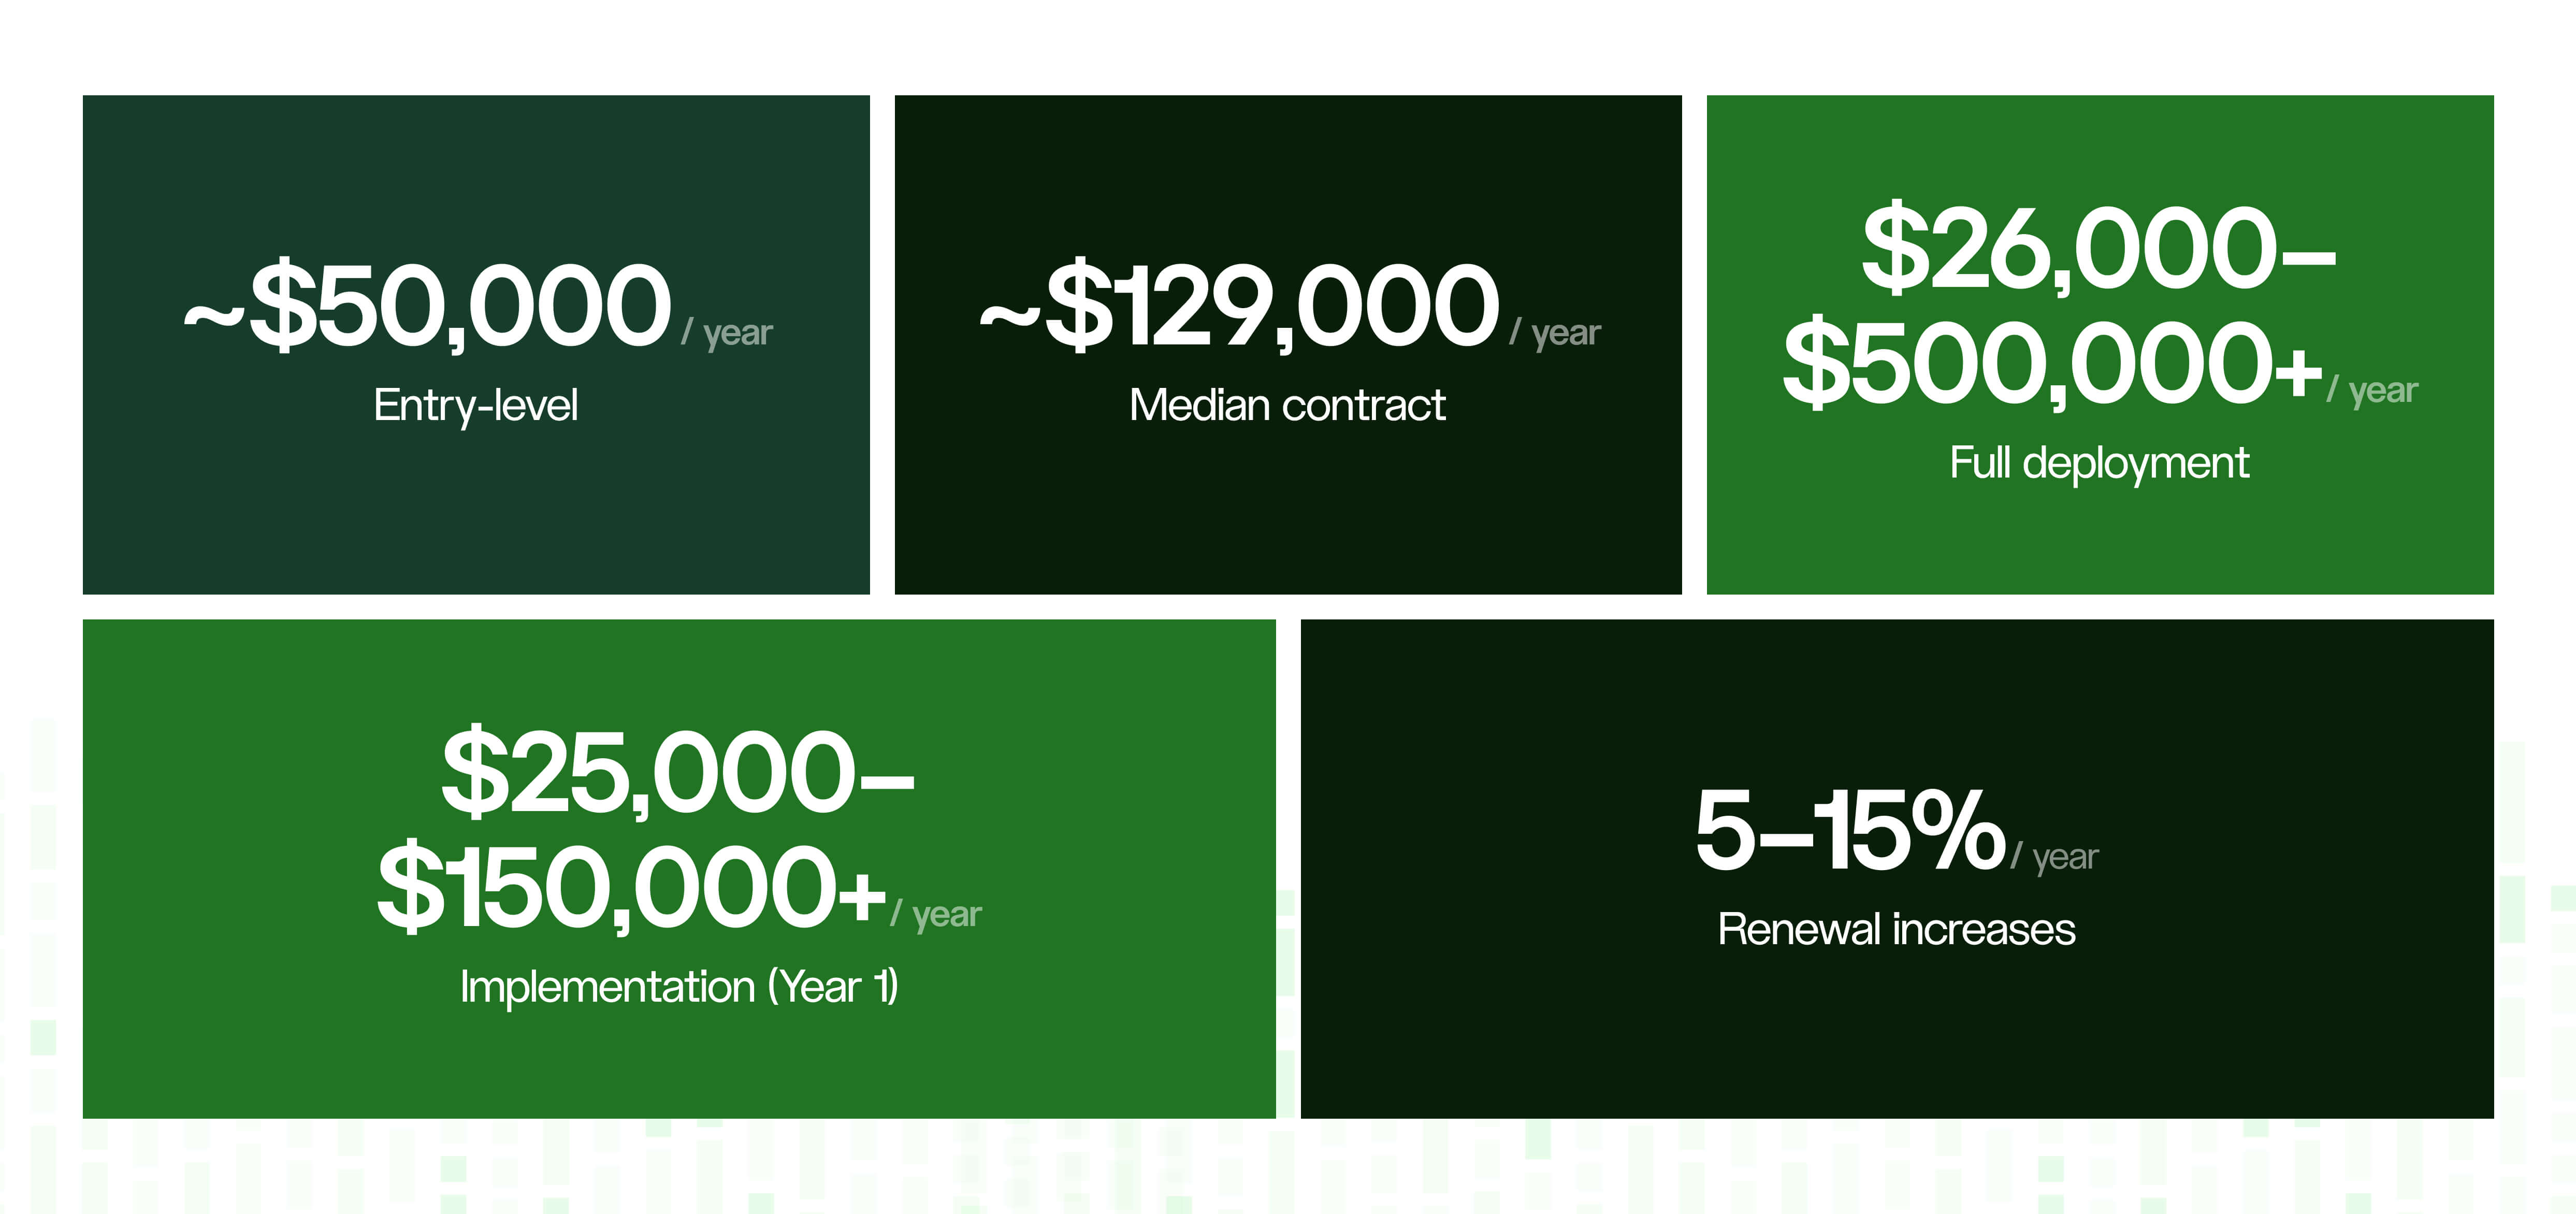
AI usage is billed separately through your own OpenAI/Anthropic keys, and overage fees kick in once you cross message thresholds.
✅ Sprinklr pros
- Good breadth: the only option here that could replace a contact center platform, a listening tool, and a publishing tool in a single contract, consolidating 30+ channels behind one login
- Compliance tooling (SOC 2, GDPR, HIPAA-grade) is built-in, with audit trails and governance controls that can make or break things in regulated industries like finance and healthcare
- Deep customization once it's configured: a flexible rules engine, custom fields, macros, and regex-based keyword detection that adapt to specific workflows
- AI features that land for some teams – smart response suggestions, auto-routing, and intelligent case distribution get praise in reviews.
- Support quality varies by product line, but Sprinklr Service has responsive, fast technical assistance
❌ Sprinklr cons
- Everything assumes you have the headcount and patience for a multi-month rollout. Reviews describe implementation as a big project requiring professional services, not a self-serve setup, with initial configuration described as "tedious" and prone to breaking on platform updates
- A steep learning curve shows up repeatedly across reviews, with features described as buried behind multiple layers of navigation.
- AI capability gaps, despite the AI-native positioning – some enterprise users on G2 describe the AI/Copilot features as "pretty terrible," unable to handle customization tasks, with inaccurate sentiment analysis and AI-generated content that needs frequent manual rewrites.
- Support experience isn't consistent across the product line. Where Sprinklr Service reviewers report responsive support, Sprinklr Social reviewers report the opposite – "inadequate support," frequent account-manager turnover, and support staff who sometimes lack product expertise
- Reliability and performance issues: slow load times on large datasets, occasional disconnects without warning, and recurring bugs (dark-mode glitches, case-transfer problems, formatting errors in AI Copilot output)
- Reporting can feel fragmented – organic and paid data often live in separate reporting areas, metrics sometimes differ from native platform statistics, and unified reporting "still feels fragmented despite improvements”
- Cost scales with seats and modules, and the add-on licensing structure specifically makes scaling more expensive over time; which is a real ongoing concern for growing teams
Who is Sprinklr best for?
Sprinklr is for large enterprises ($100M+ revenue, 50+ people touching CX tooling, global compliance requirements) that want one system of record and have the budget and internal bandwidth to run a real implementation project.
Datashake: pricing, pros, and cons (2026)
If neither Brandwatch nor Spriklr work for you – too much dashboard, not enough data, or a price tag that only makes sense once you're already locked into a 12-month contract: we’ve got an alternative for ya.
Datashake is a social and review data infrastructure provider, not a social listening platform.
Instead of bundling collection with a dashboard and a seat price, it collects and normalizes data from 150+ social and review sources – social platforms, 100+ review sites, forums, e-commerce, and app stores – and delivers it via API.
Usage is metered in credits rather than seats: a standard request costs 1 credit, a JavaScript-rendered request costs 5. Every tier includes unlimited bandwidth.
✅Datashake pros
- Usage-based, not seat-based. You pay for what you collect, not for how many people are logged in
- Broad, normalized coverage: 150+ social and review sources unified into one schema, with 5+ years of historical data available on most sources rather than the archive starting the day you sign up.
- Simple to integrate: a G2 reviewer described the process as needing "just... a link" to start pulling data, with no complicated setup to get through first.
- High uptime for a data-infrastructure product: 98.3% uptime
- Responsive support: a reviewer called out response times as "top-notch."
- Fills the gaps official APIs leave behind. A lot of earned and shared data (reviews, forums, e-commerce, app stores) lives on platforms that either don't publish a public API at all or don't offer one reliable enough to build on. Datashake reaches those sources directly, instead of being limited to whatever a platform's own developer program decides to expose.
❌ Datashake cons
- Usage-based costs can be less predictable than a flat subscription. Any usage-based model carries a trade-off: a spike in collection volume (a viral event, a new market you start tracking) moves your bill in real time. It cuts both ways, though: a quiet month costs less too, instead of paying the same flat fee whether you used the platform or not.
- You need to build the layer above it. The pricing above covers the data; the dashboard, models, or analysis your team actually looks at is yours to build or buy separately. That's the point of buying data as infrastructure rather than a platform, but it's worth being clear-eyed about going in.
Who Datashake is best for
Teams building a product, dashboard, or research function on top of social or review data – not a team that wants to log into a UI and read a sentiment score off it.
Brandwatch vs. Sprinklr vs. Datashake: comparison table
How much does it cost to build your own social data pipeline? (2026)
It’s easy to get this part wrong, because usually whoever's estimating it has never had to keep a scraper alive through a platform's third unannounced layout change of the quarter. 😅
So here's:
- What each platform lets you access
- Whether collecting the rest yourself is legal
- And what a real in-house build costs once you count the engineers who have to keep it running.
Official platform APIs in 2026: what's available
Has your team ever tried the just pull the data straight from each platform's API route? Here's what that gets you in 2026, platform by platform ⬇️
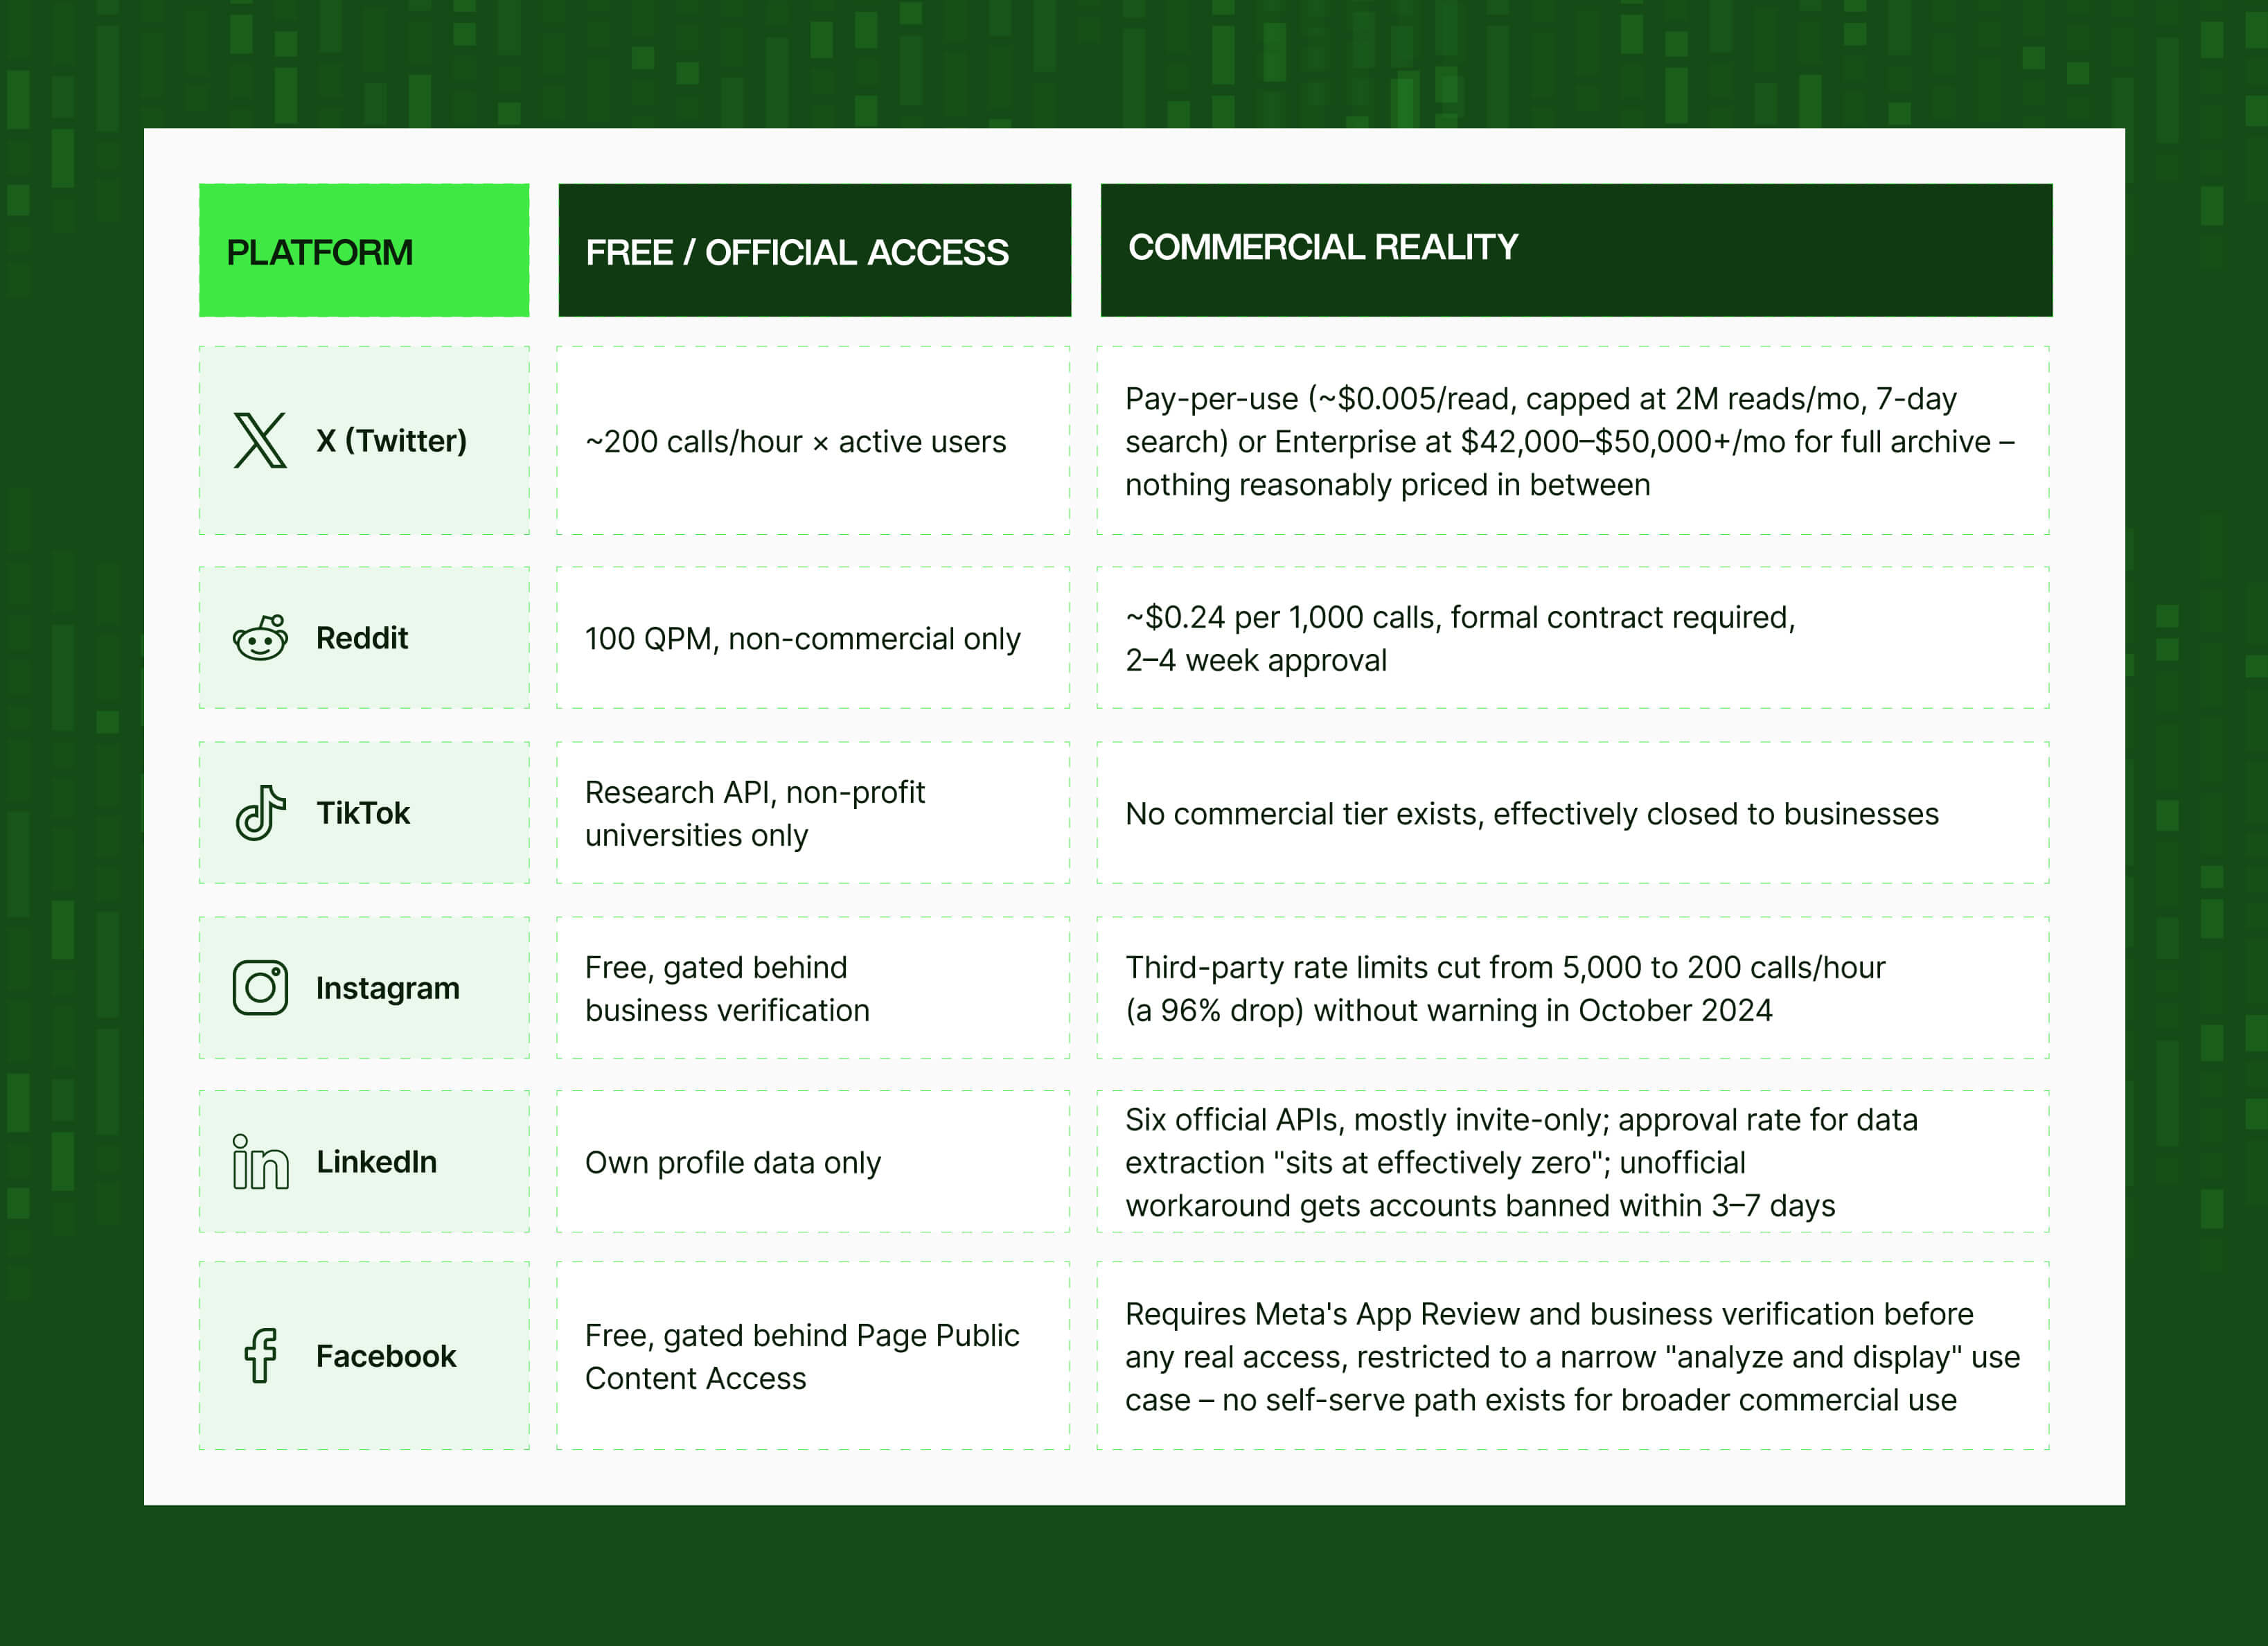
YouTube is the one exception. Everywhere else, getting broad, reliable coverage means choosing between two expensive paths: pay each platform's enterprise tier separately or skip the official APIs and collect the data yourself.
Is web scraping legal? GDPR vs. CCPA
Yes, generally, for publicly accessible data you don't need to log in to see.
hiQ Labs v. LinkedIn (decided by the Ninth Circuit on April 18, 2022) found that scraping public, unauthenticated data doesn't violate the Computer Fraud and Abuse Act.
A second case, Meta Platforms, Inc. v. Bright Data Ltd. (N.D. Cal., January 2024), reinforces the point from a different angle: on summary judgment, the court ruled that Meta's own Terms of Service don't bar logged-out scraping of public data, since the ToS only govern people actively logged into an account.
Together, the two cases mean the CFAA doesn't block logged-out public scraping, and neither, generally, does a platform's own ToS.
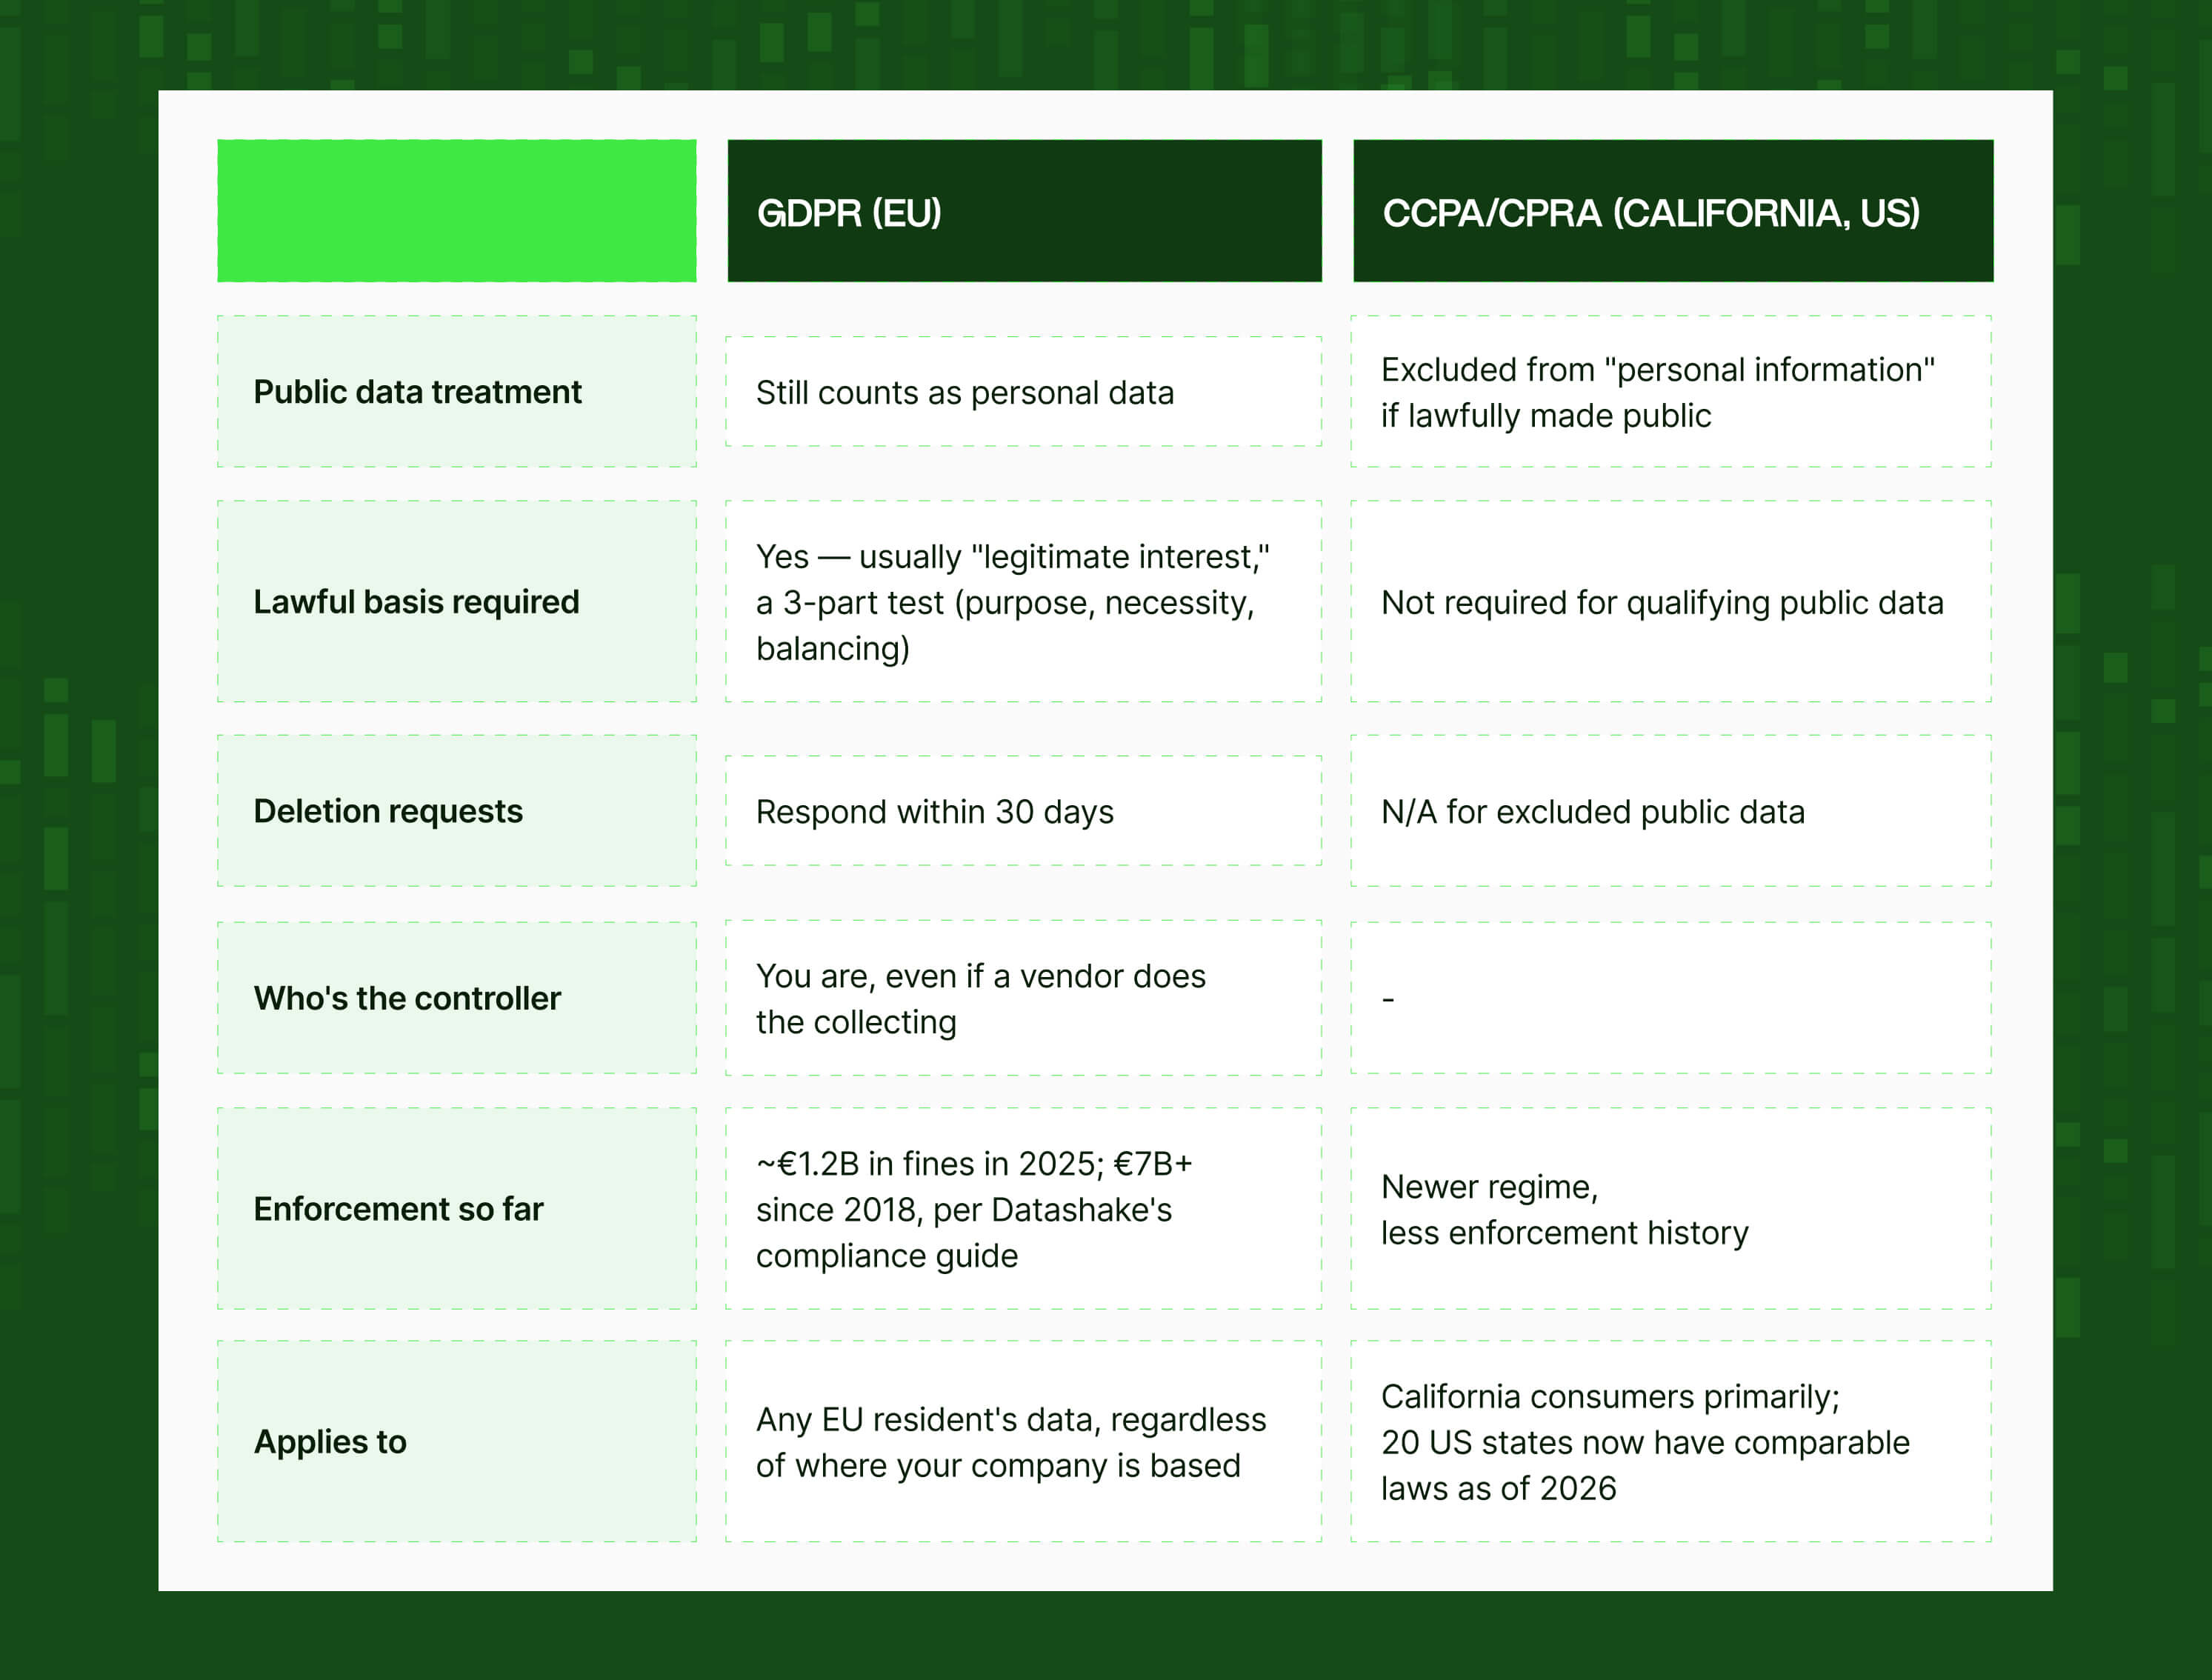
Where it gets more complicated is privacy law, and the US and EU disagree on how public data should be treated:
- Public data treatment: Under GDPR, publicly visible data still counts as personal data. Under CCPA/CPRA, it's excluded from "personal information" if lawfully made public.
- Lawful basis required: GDPR requires one – usually "legitimate interest," a three-part test covering purpose, necessity, and balancing. CCPA/CPRA doesn't require one for qualifying public data.
- Deletion requests: GDPR requires a response within 30 days. Under CCPA/CPRA, this doesn't apply to excluded public data.
- Who's the controller: Under GDPR, you are, even if a vendor is doing the collecting. CCPA/CPRA doesn't assign this role the same way.
- Enforcement so far: GDPR enforcement is substantial and growing, roughly €1.2B in fines in 2025 alone, and €7B+ cumulatively since 2018. CCPA/CPRA is a newer regime with a much thinner enforcement history so far.
- Who it applies to: GDPR covers any EU resident's data, regardless of where your company is based. CCPA/CPRA applies primarily to California consumers, though 20 US states now have comparable laws as of 2026.
What building in-house costs in 2026
In our build-vs-buy cost breakdown, we priced out what a full, multi-platform social data pipeline costs to run:
A real social data pipeline needs seven infrastructure layers, not just a scraper ⬇️
- Data ingestion – pulling raw data from each source
- Data transformation – normalizing formats across platforms
- Storage – housing structured and unstructured data at scale
- Orchestration – scheduling and coordinating collection jobs
- Observability – detecting failures and data quality issues
- Activation – making the data usable downstream (dashboards, models, alerts)
- Governance – access control, compliance, and data retention
- Plus the talent to build and keep the other seven running: it’s easy to underestimate the effort if you plan for ingestion, and skip budgeting for the people, which is where ongoing maintenance costs pile up.
Each of these put together come out to $4.19M–$7.93M over three years, and 9–15 months before any of it is in production.
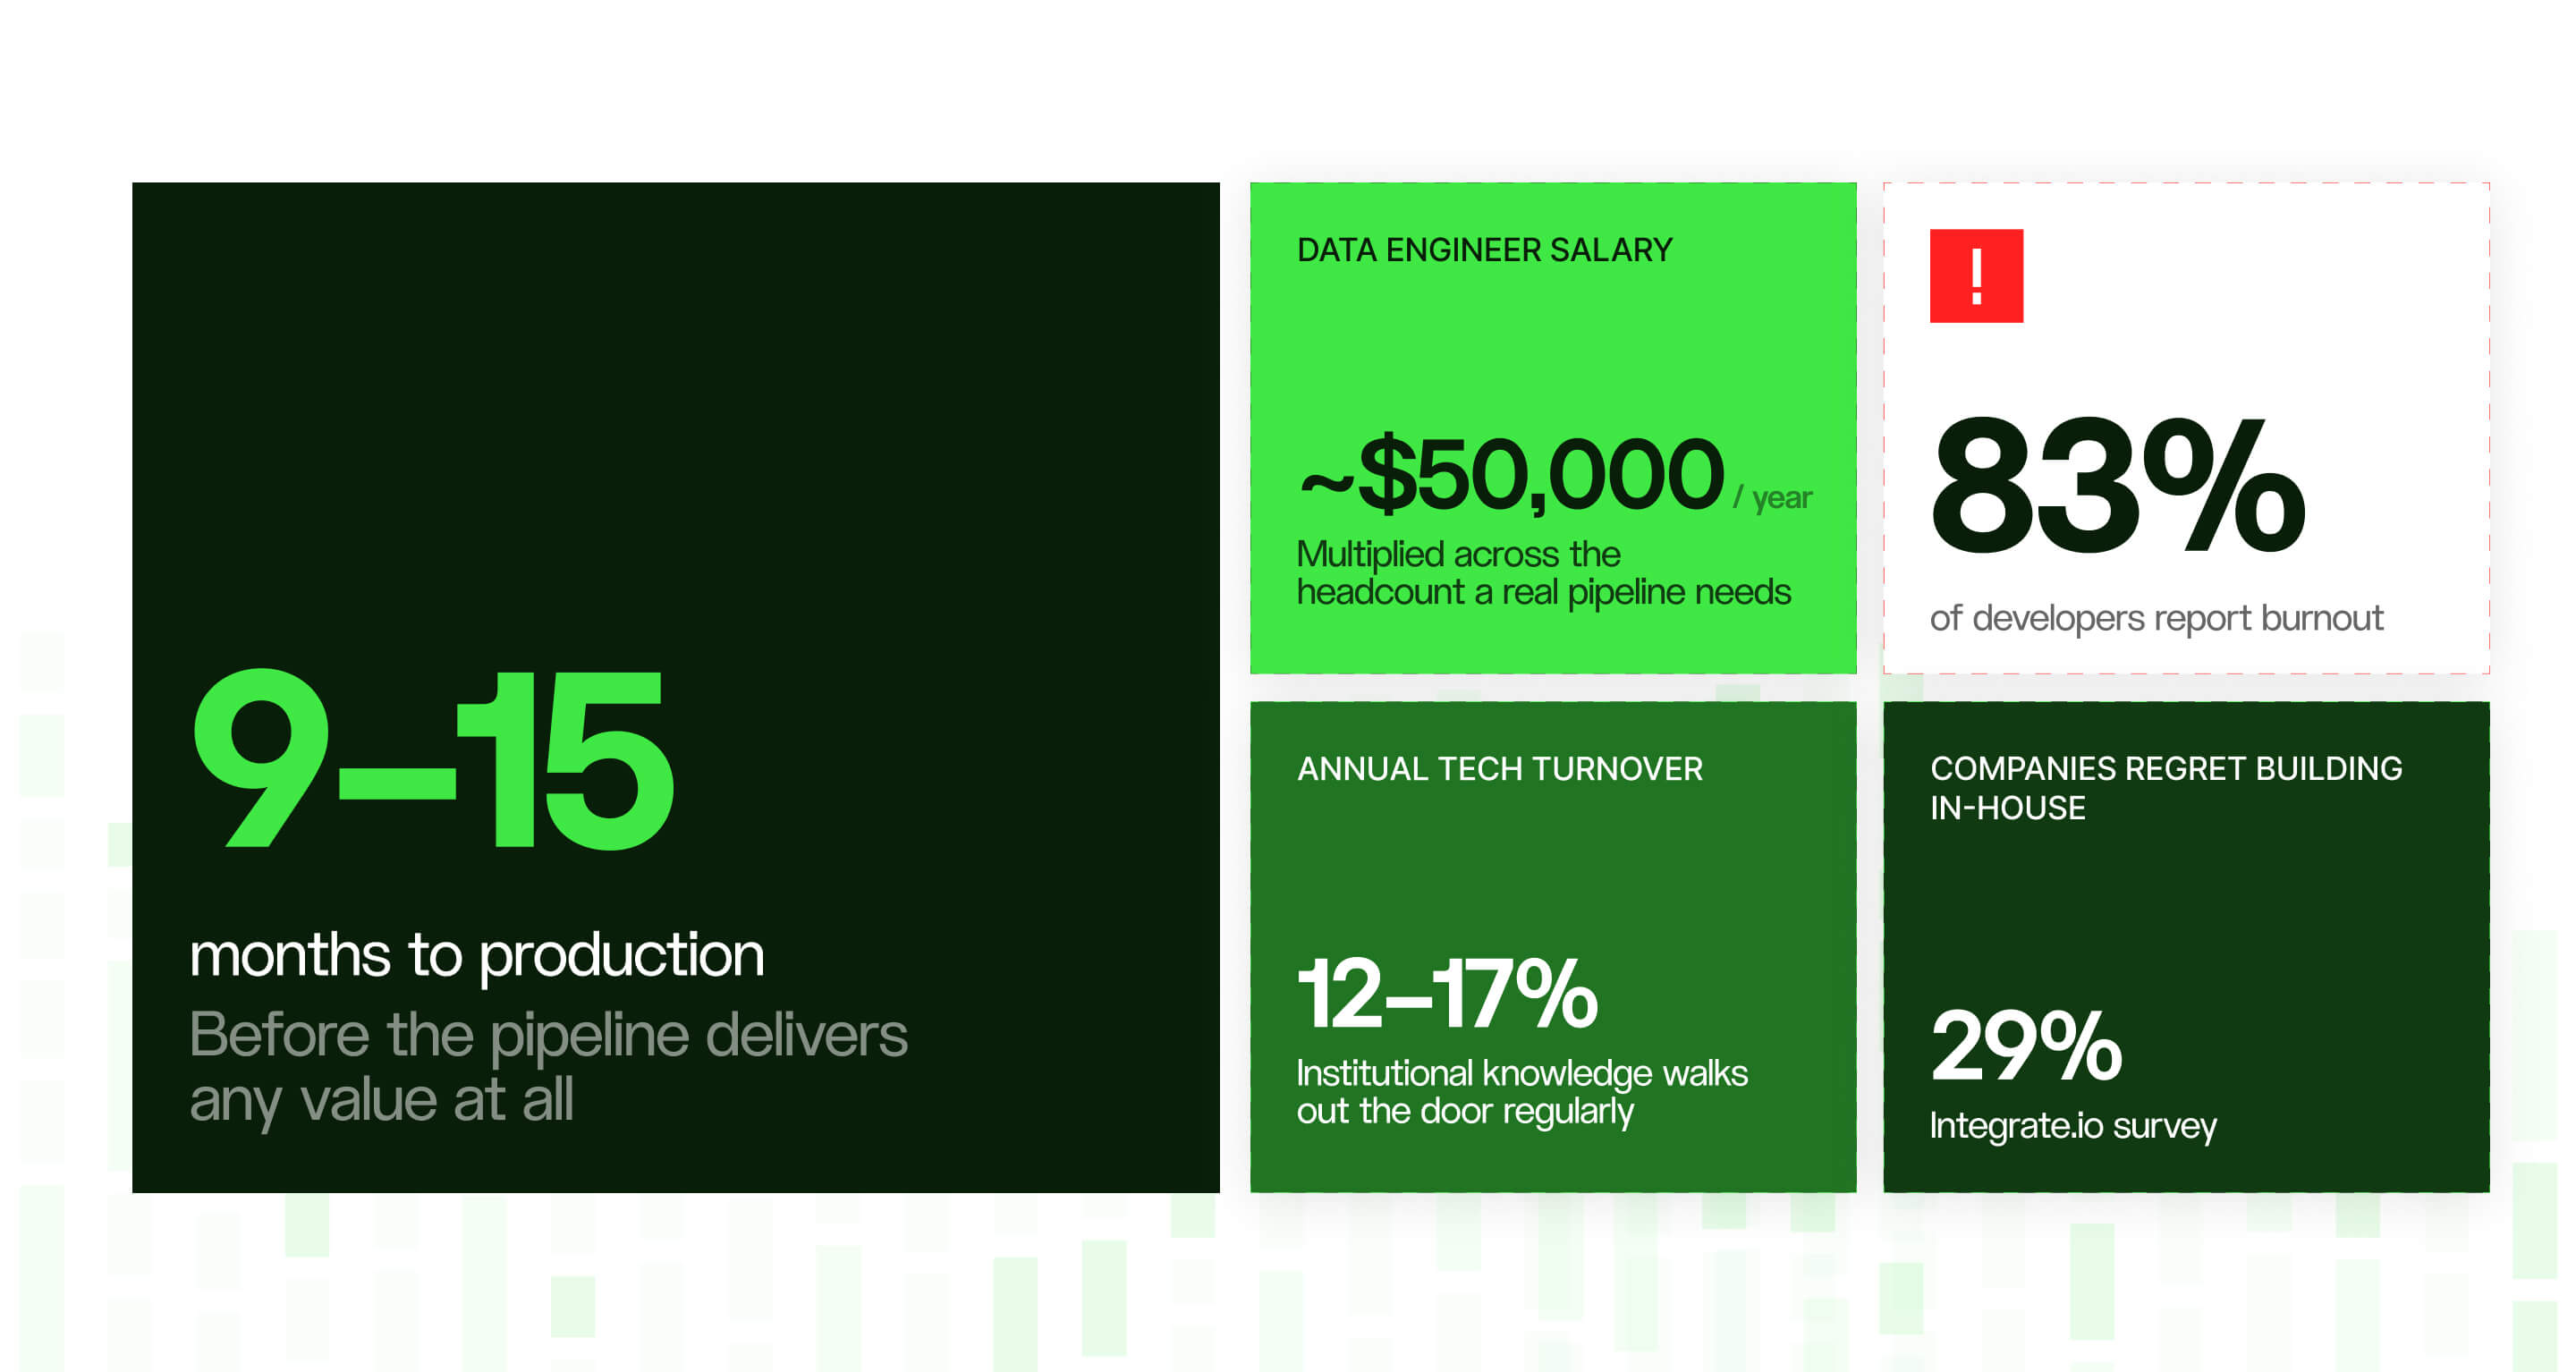
Maintenance is where this estimate usually goes sideways.
You budget for occasional upkeep, and somewhere along the way it turns into a second full-time job for your engineers, because every platform ships breaking changes on its own schedule, with zero notice and zero obligation to warn you.
Our review-scraping analysis (a smaller job than a full social pipeline) puts a minimum viable team at $650K–$850K in year one, climbing to $925K+ by year three as you add more sources.
Yep, maintenance doesn't shrink on its own, it just keeps growing.
So is building ever actually worth it? Yes, but really only in two situations:
- You've got a proprietary collection need that nobody else serves, and off-the-shelf tools just weren't built for it.
- Data collection is the product you're building, not an input to something else. Here, the maintenance burden is the business, not a tax on it.
Outside those two, building is usually the wrong call, and the maintenance eats into the exact work the data was supposed to be feeding.
Why no social listening tool sees 100% of the conversation
Ask the people doing this work: 64% of social intelligence professionals name tool limitations or integration issues as the single biggest constraint on their work, as seen in The SI Lab's 2026 State of Social Intelligence survey of 330 practitioners. Regardless of whose logo is on the dashboard.
Even the two biggest names don't see the whole picture. Yep, Brandwatch and Sprinklr are both built on the same official platform APIs ⬇️
How much of the conversation are you seeing?
Conversations happen across 150 social media platforms & online review sites, adding millions of blogs, forums and portals (traditional media) with wholly different audiences, and a lot of that conversation never touches the channels a listening tool watches:
- 82% of social conversation about a given brand happens outside that brand's own official channels – in comments, forums, and reviews nobody tagged the brand into
- 30% of marketing and comms professionals run two or more listening tools at once, with combined budgets landing in the $100K–$199K range
- Data completeness can drop to 20–40% during high-volume events, exactly when you'd want the full picture, not a sample of it
- Instagram Stories, reaching 500 million people daily, aren't accessible through official APIs at all
Neither Brandwatch nor Sprinklr can conjure data the platforms themselves won't hand over, they're both working with the same restricted spigots everyone else is.
Why coverage breaks down: 3 hidden mechanisms
There are three separate technical mechanisms that strip data out before it ever reaches a dashboard ⬇️
1. API rate limits
Platforms cap how many requests a tool can make per minute, hour, or day, and when a tool hits that ceiling, it doesn't slow down gracefully, it stops. No warning, no error message, it just stops collecting.
X/Twitter's paid Basic tier, for example, caps out at 10,000 tweets a month. Yet a single trending hashtag can generate hundreds of thousands of tweets in a few hours, meaning that monthly allowance can be gone before lunch on the day it matters most.
2. Platform sampling
Even below the hard rate-limit ceiling, platforms often don't return every matching result; they return a sample.
Meta's Graph API documentation acknowledges that "high-volume queries return sampled results" without ever specifying what percentage or when sampling kicks in.
3. Content filtering
None of this is even the full cost of going the official route, either.
Where an API access tier does exist, it's rarely priced for a team that just wants reliable coverage:
- X's pay-per-use tier caps out at 2 million reads a month with a 7-day search window, and the next step up is a $42,000–$50,000+/month Enterprise contract for full-archive access; nothing reasonably sized in between.
- Reddit charges roughly $0.24 per 1,000 calls behind a formal contract and a 2–4 week approval process. Large, rigid packages are the norm; a flexible, pay-as-you-go plan sized for actual usage generally isn't on the menu.
- And even once access is sorted, each platform still means its own integration to build, its own authentication and rate limits to respect, and its own schema to normalize into something usable. Repeat this for every source your coverage strategy needs, and do this again every time a platform changes its API without warning.
- Multiply that across a real source list, and you're running a small integration team before you've analyzed a single mention, which is the work a provider like Datashake takes off your plate.
Platform demographics: why source mix matters
Miss a platform, and it's an entire slice of your audience gone, because each platform skews toward a different age, gender, and region:
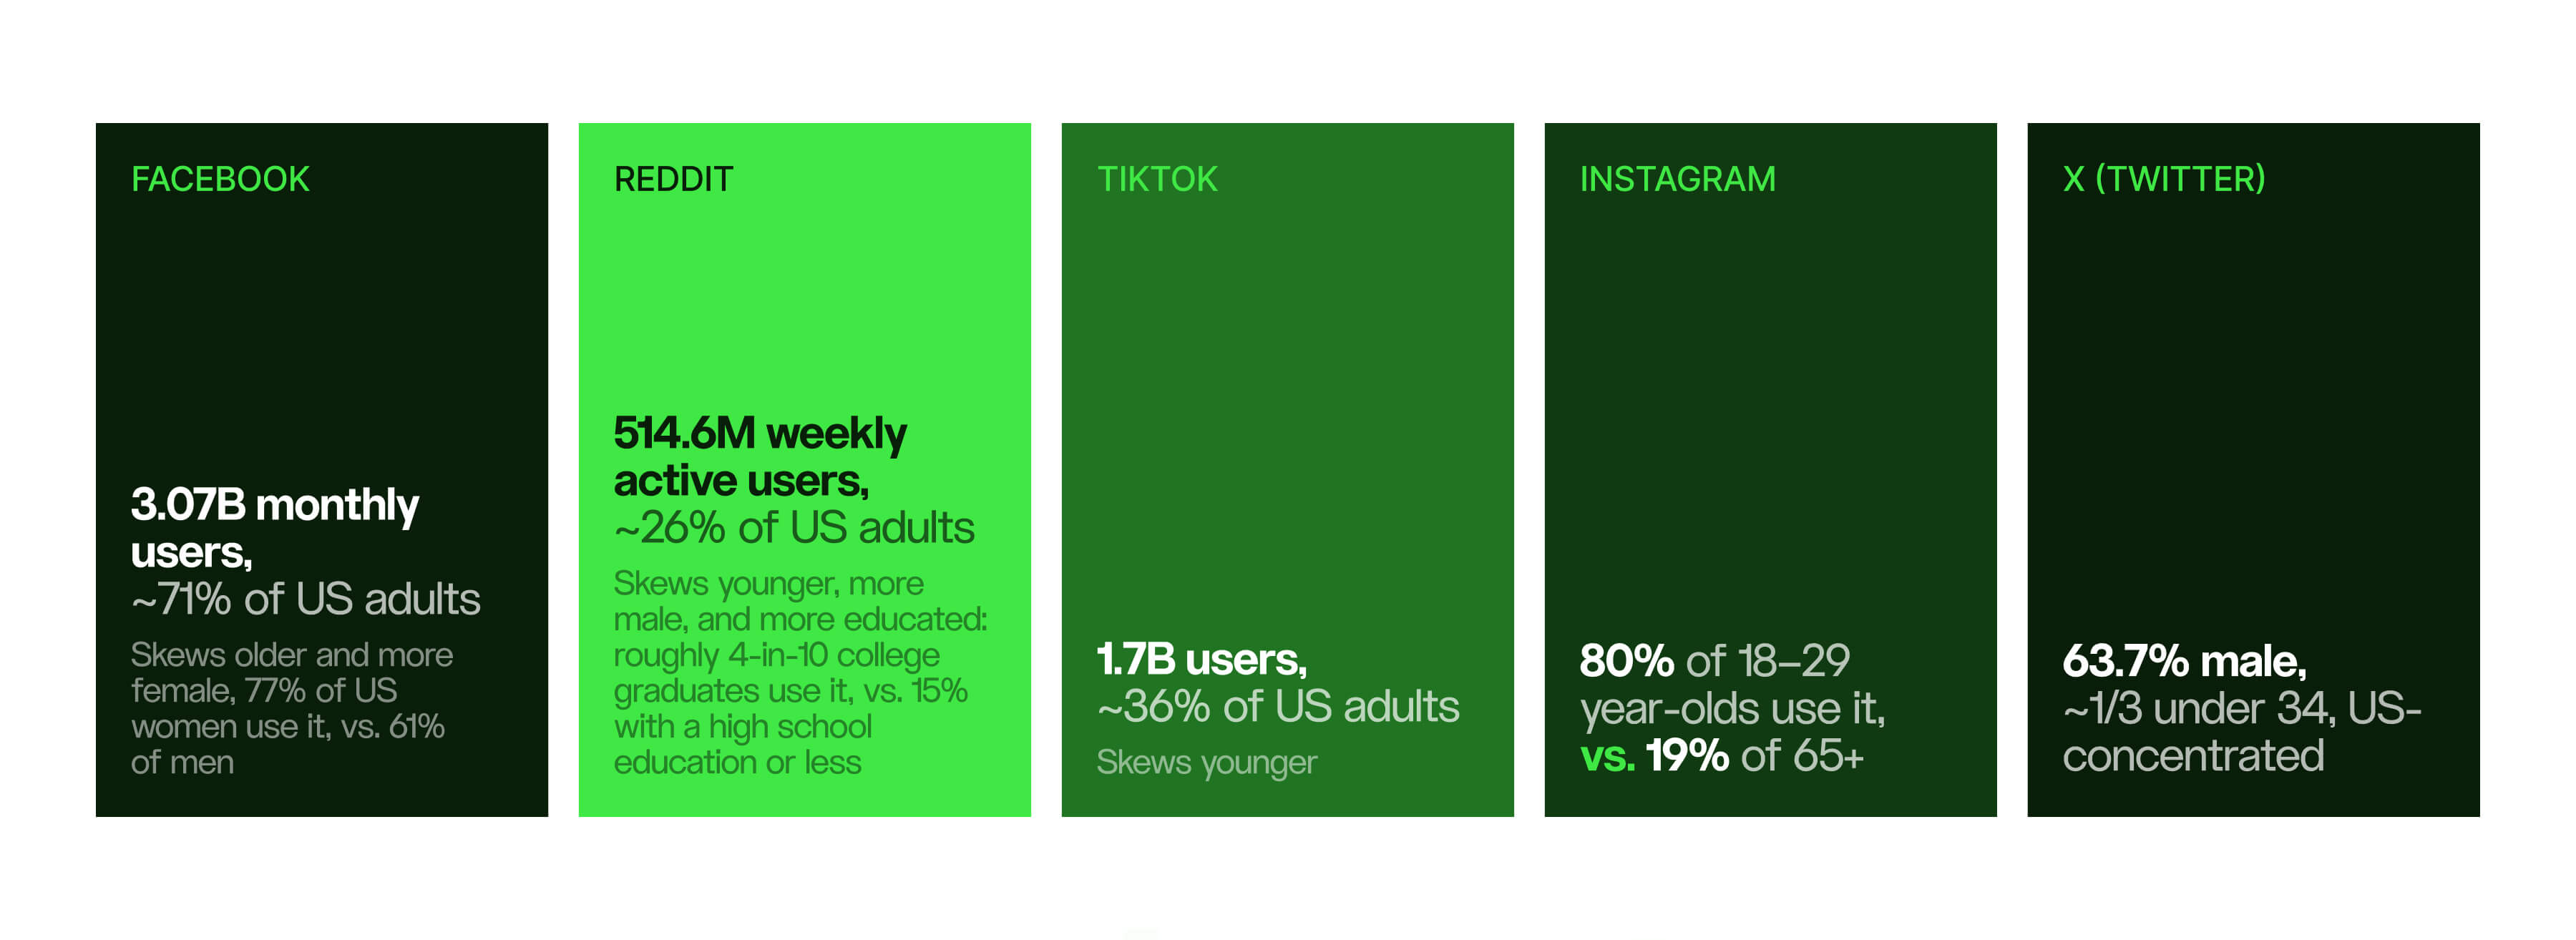
Look at what each row costs you if it's missing.
➡️ Skip TikTok, and you lose the platform where over a third of US adults are, skewed younger than almost anywhere else you'd look.
➡️ Skip Instagram, and you cut out the exact group most likely to be talking about you in the first place – 80% of 18–29 year-olds use it, against 19% of people over 65.
➡️ Skip X, and the gap runs the other way: a mostly male, mostly under-34, mostly US-based conversation that reads nothing like what's happening on Instagram or TikTok.
These are all different audiences, with different languages and different reasons to bring your brand up at all.
The same blind spot shows up in competitive intelligence tools
This isn't unique to listening platforms, it shows up from a different angle in competitive intelligence too.
The standard CI stack (tools like Crayon, Klue, Kompyte, Contify, Semrush, and Similarweb) is strong at tracking what competitors say about themselves – pricing pages, press releases, job postings – but weak at tracking what competitors' customers say about them on app stores, Glassdoor, e-commerce platforms, and specialist forums.
It’s because of the same underlying issue: review-heavy, long-tail sources are the ones every these tools under-serve by default.
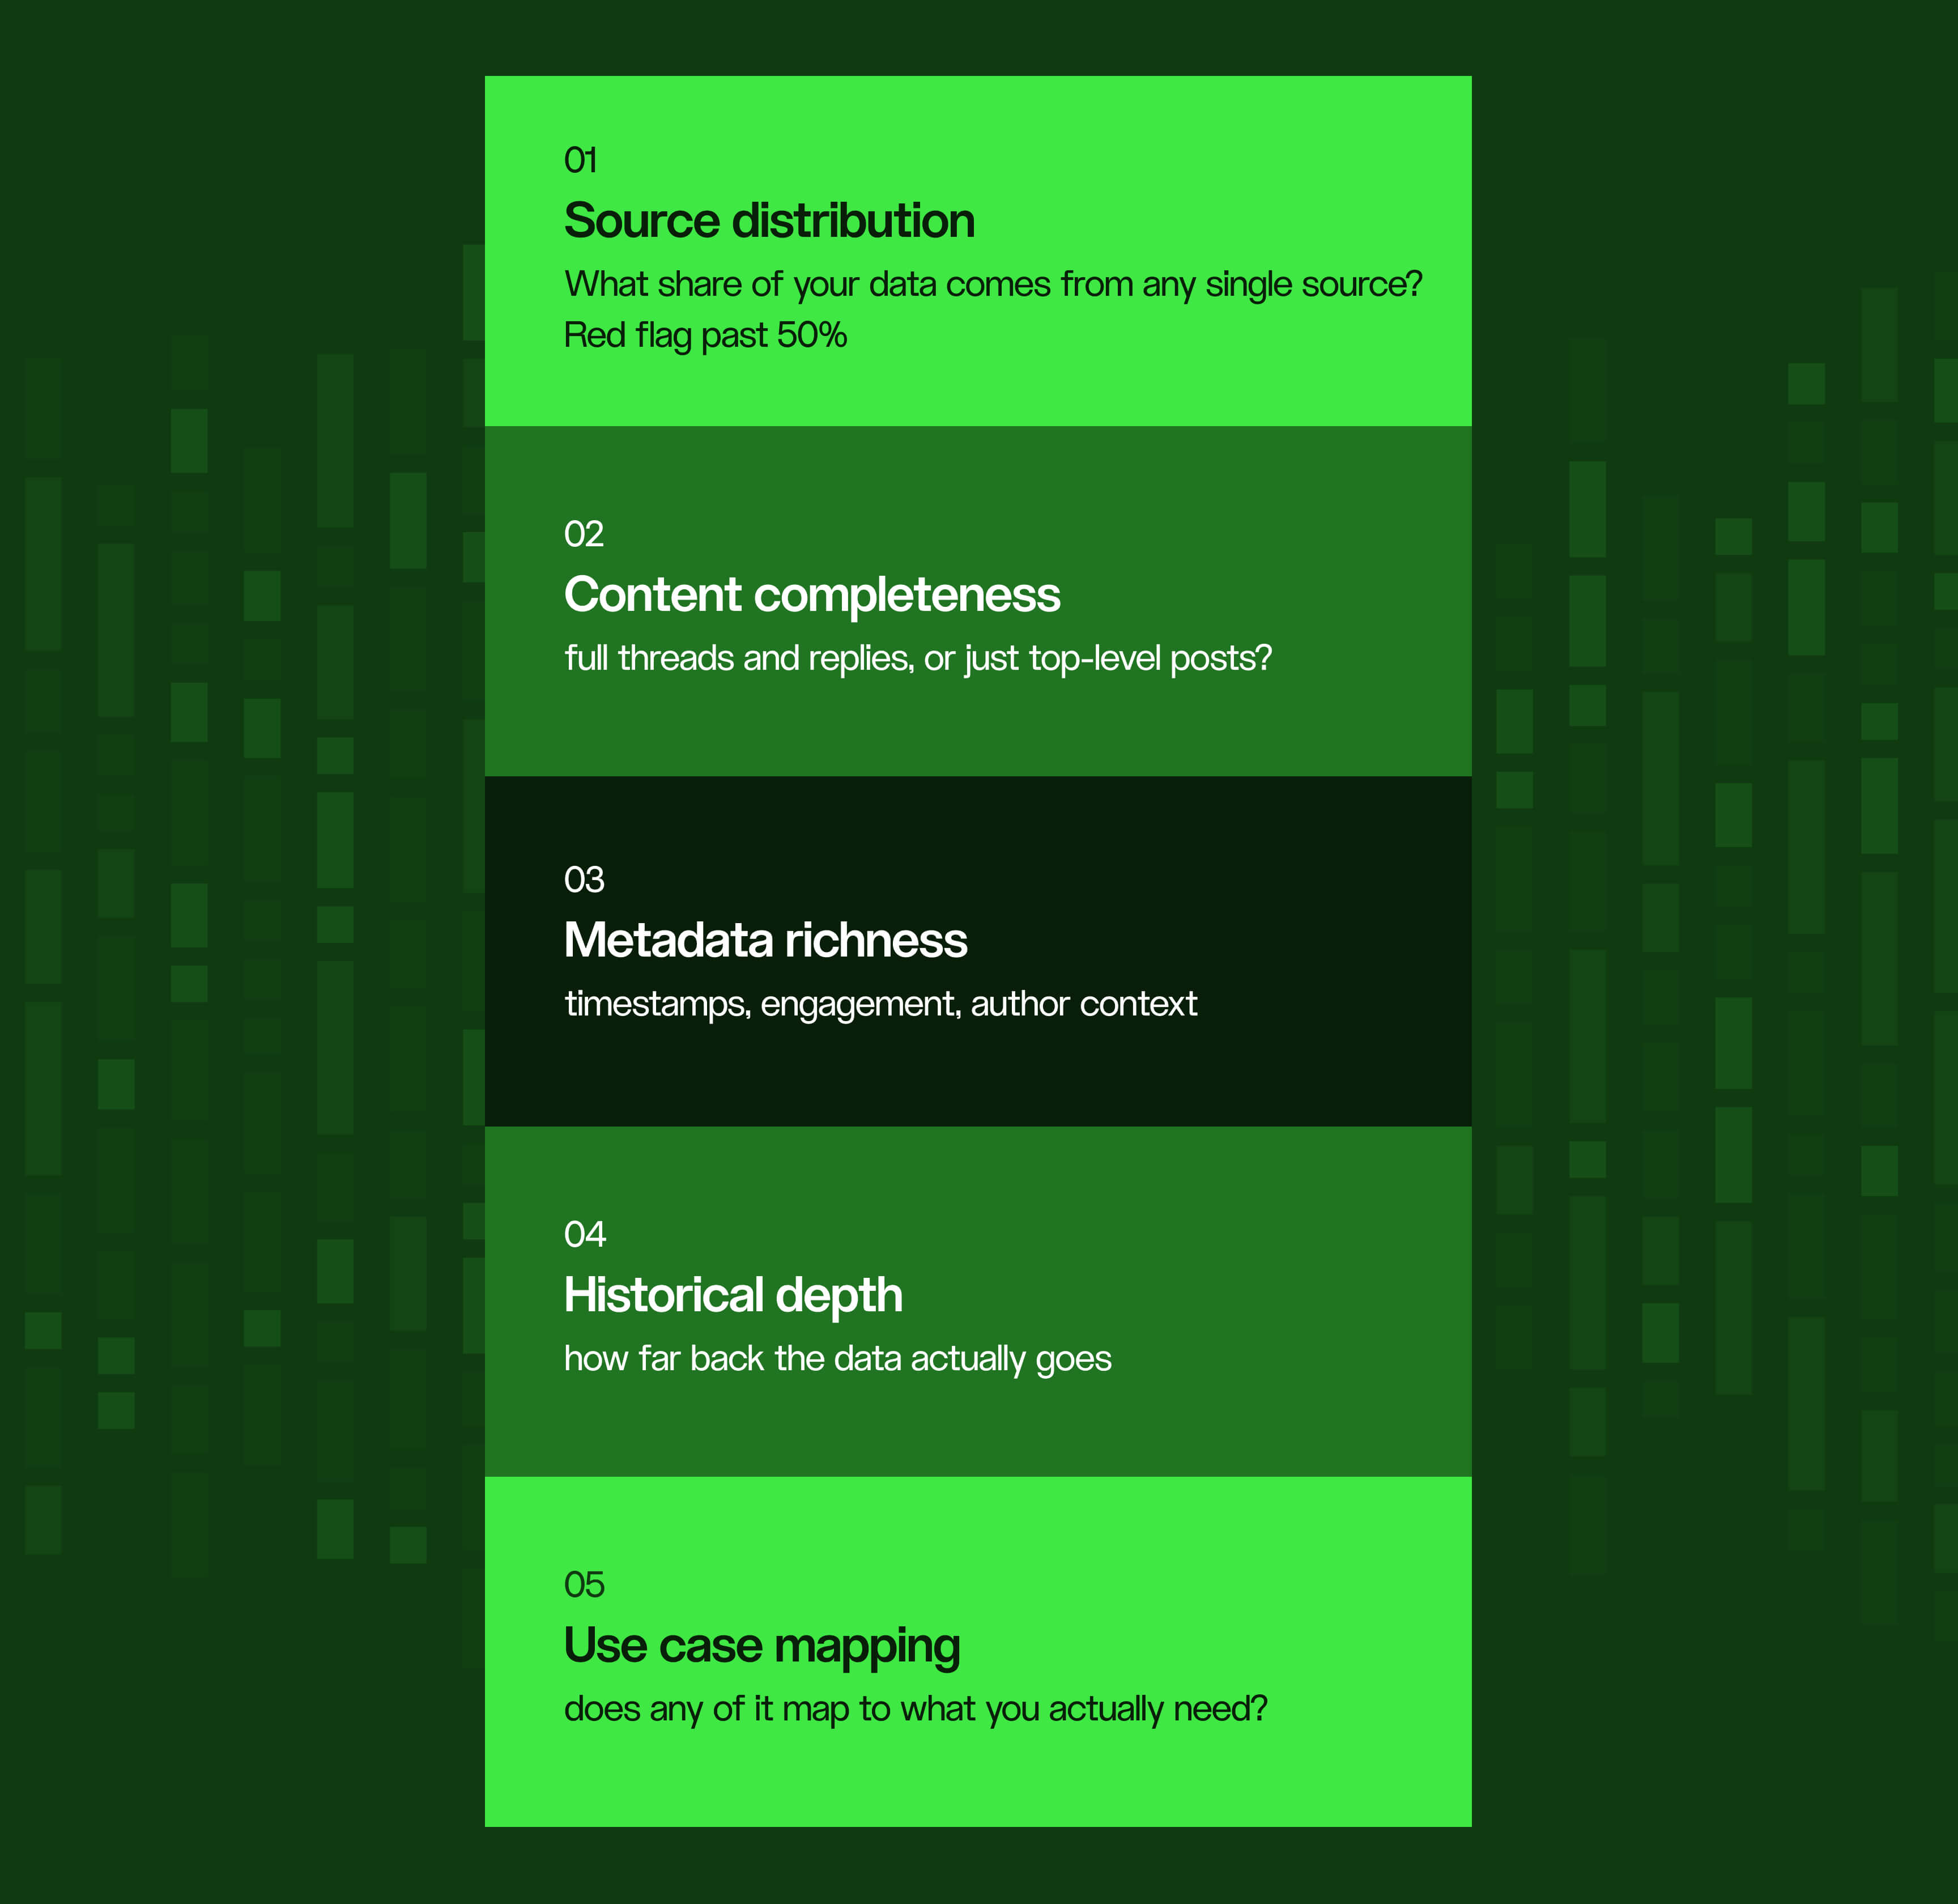
A 5-point audit to check your own coverage
If your actual need leans heavily on review sites, niche forums, or long-tail sources rather than the big five social networks, test your real source list against a trial before signing anything.
Our coverage framework breaks the audit into five checks:
- Source distribution – what share of your data comes from any single source (red flag past 50%)
- Content completeness – full threads and replies, or just top-level posts?
- Metadata richness – timestamps, engagement, author context
- Historical depth – how far back the data actually goes
- Use case mapping – does any of it map to what you actually need?
Why owning raw data beats owning a dashboard
A dashboard and a data feed answer different questions. Datashake sits on the data side of that line: instead of bundling collection with a dashboard and a per-seat price, it collects and normalizes social and review data from 150+ sources and hands it over via API, priced on what you use.
There's no dashboard bundled in, because it’s built for teams that need the data itself, not another UI for someone to log into and check.
➡️ A listening dashboard tells you what people are saying, but only through whatever charts and sentiment scores the tool in front of you – Brandwatch, Sprinklr, or otherwise – shows. Ask it a question its interface wasn't designed for, and the answer doesn't exist. ⚠️
Raw data skips that translation layer. It's the same conversation, still attached to its full text, timestamp, and metadata, arriving with nothing pre-decided on your behalf.
The churn signals hidden in reviews
Public reviews tend to surface churn risk 4–8 weeks before usage dashboards or health scores catch it, because a review captures how someone feels before they've consciously decided to leave:
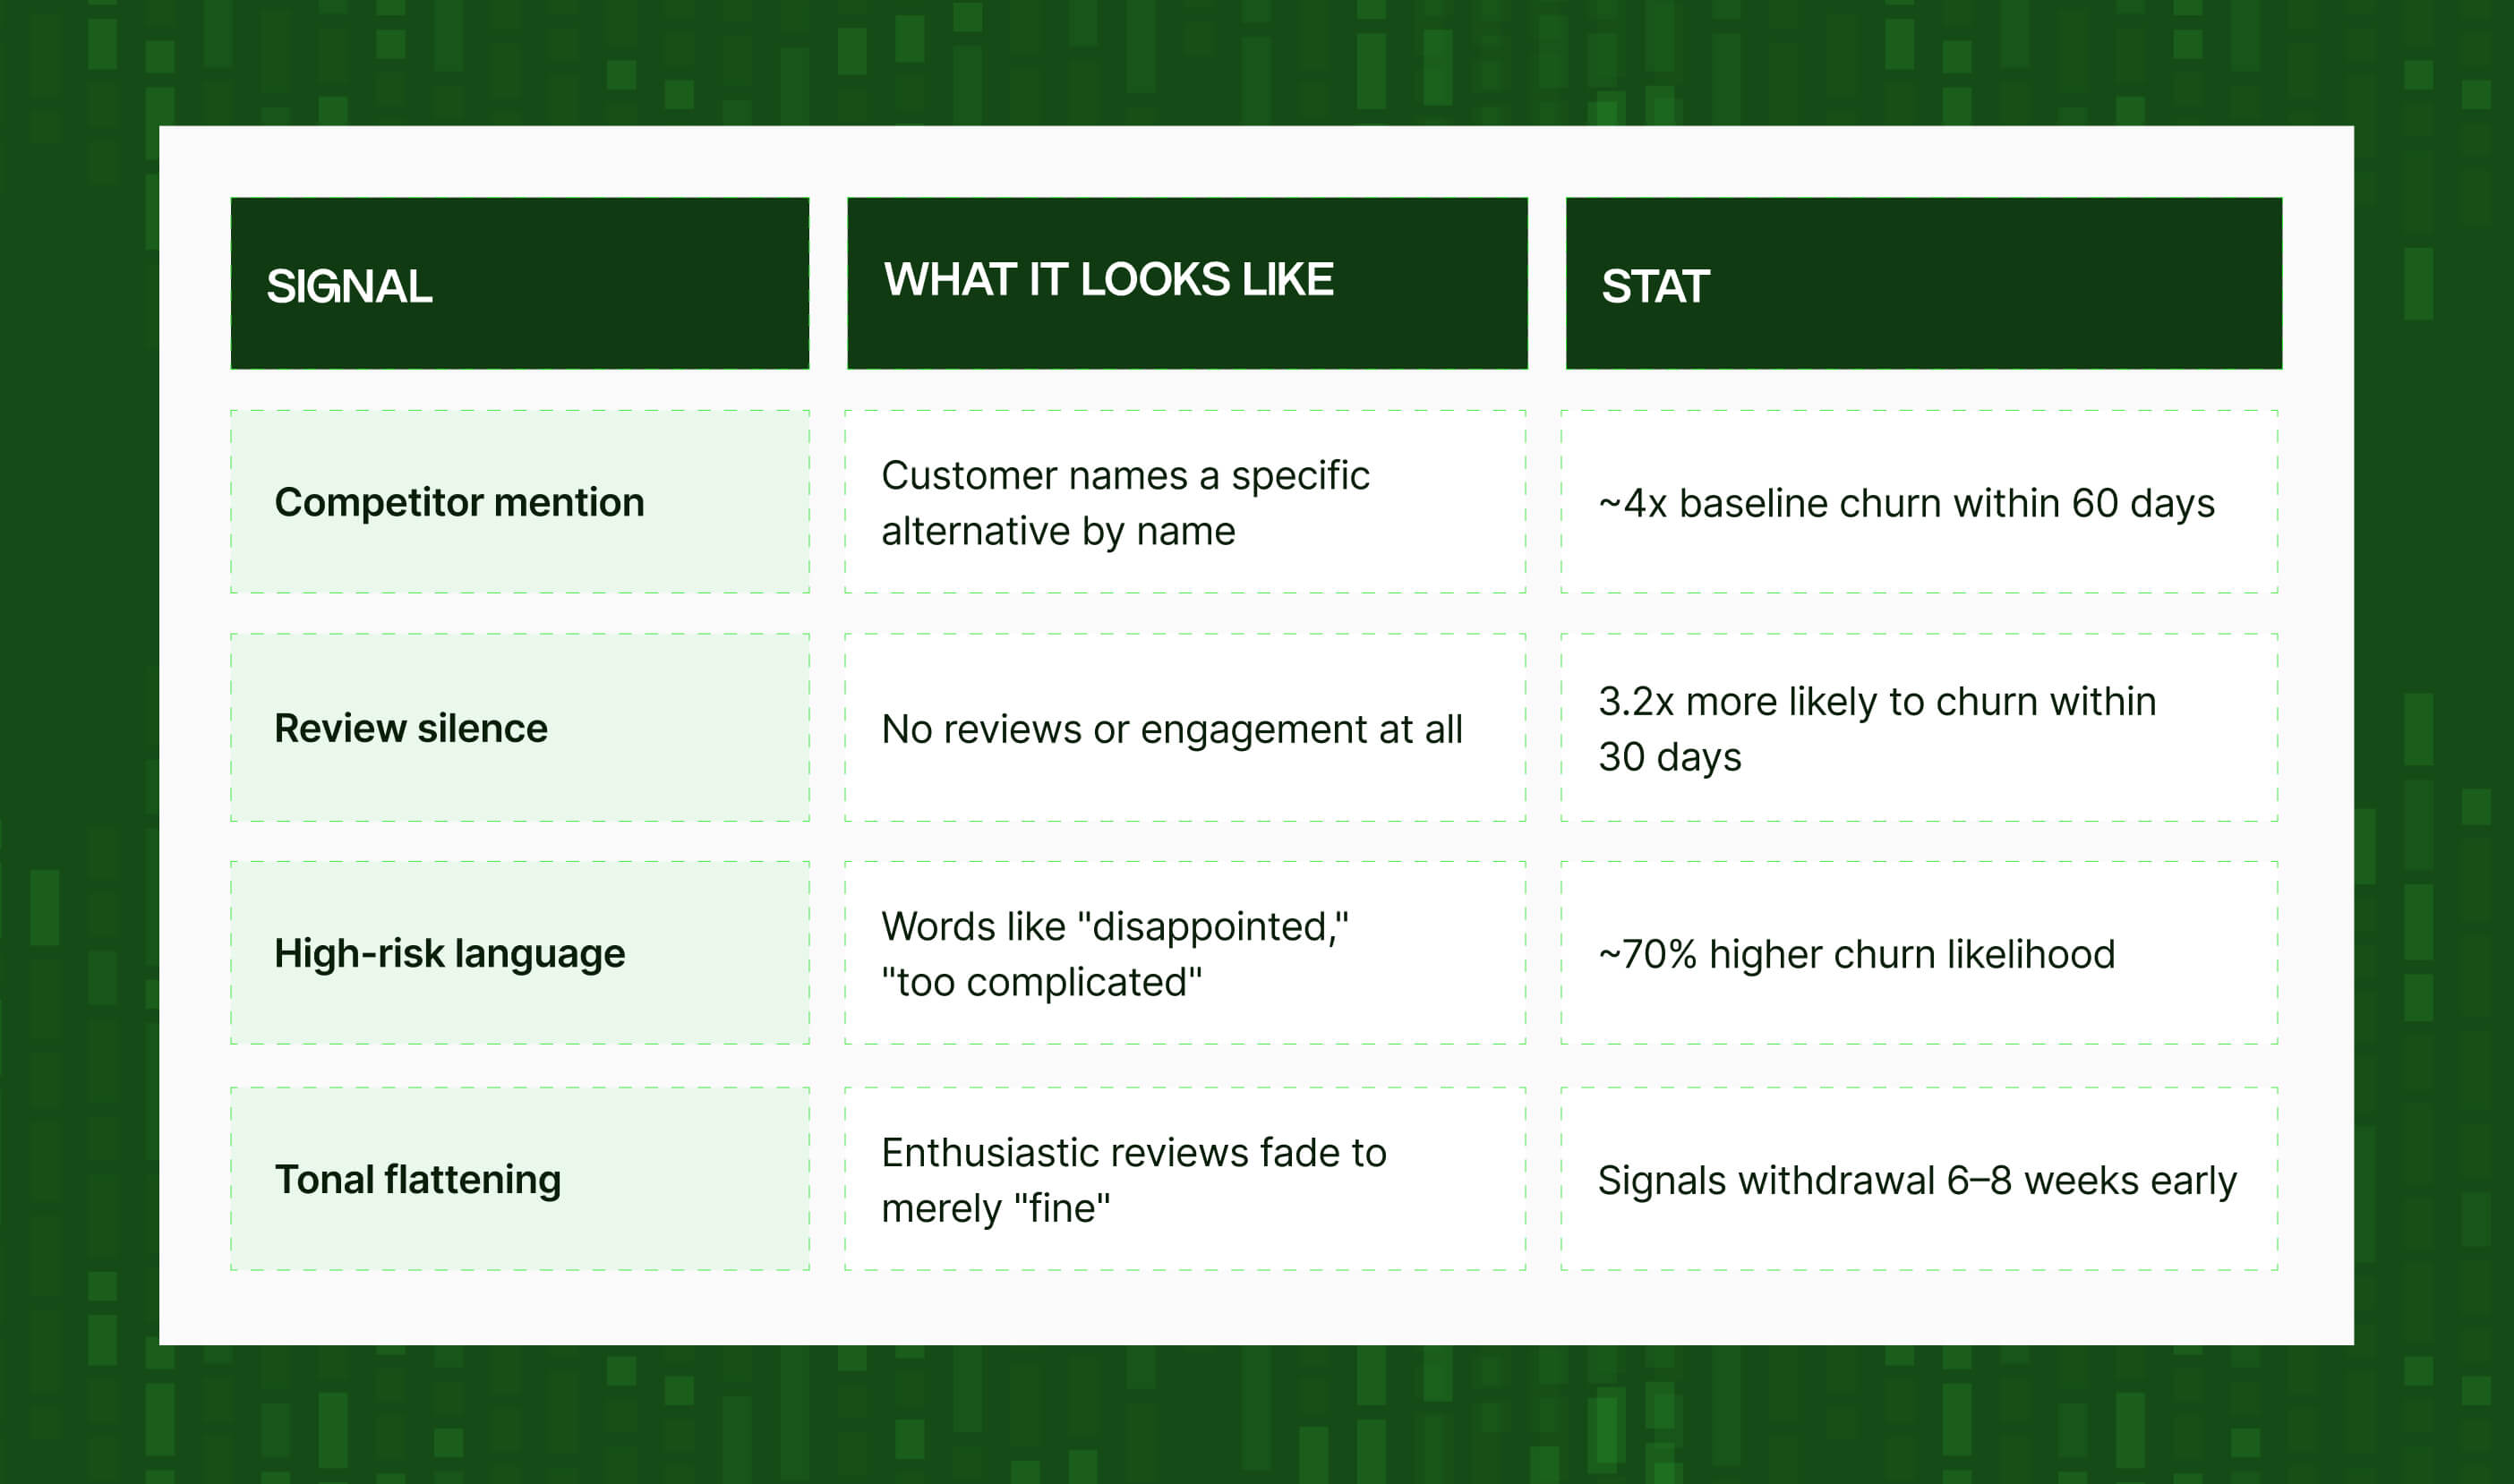
Only 1 in 26 unhappy customers actually complains directly, the other 25 just leave, which is exactly why the silence itself is worth tracking as a signal, not just the complaints.
None of that ships as a feature in a standard listening dashboard, because it isn't a dashboard feature. It's a model built on top of raw review data, tuned to your own customers.
Neither Brandwatch nor Sprinklr will hand you a churn model out of the box, but the same review data feeding either platform's sentiment score could feed one, if you're not locked into their UI as the only way to use it. 👏
How to choose: 5 questions to ask before you buy
Choosing between Brandwatch, Sprinklr, building in-house, and buying raw data comes down to five questions:
- Is the deliverable a dashboard your team logs into, or something you're building on top of the data? If the end user is a marketing or comms teammate checking sentiment and scheduling posts, that's Brandwatch or Sprinklr territory. If the end user is downstream code, a data warehouse, or a product your company sells, you want clean data feeding your own logic, not a UI you'll never open.
- Does per-seat pricing match how your team actually grows? Per-seat pricing punishes broad internal access, since every stakeholder who wants visibility becomes a line item. Usage-based data pricing punishes volume instead, which fits situations where a lot of people need occasional insight but only a small team touches the raw feed.
- Do you need sources beyond mainstream social – reviews, forums, niche platforms? Verify coverage against your real source list rather than a vendor's marketing page, especially if long-tail sources matter more to you than the big five networks.
- Do you have 2-3 dedicated engineers you can commit indefinitely, not just for a sprint? Without it, "build" turns into "under-maintain", and a stale pipeline that looks like it's working is more dangerous than one that's obviously down.
- Do you need certified compliance out of the box – HIPAA, SOC 2, formal data-processing agreements? If you're in a regulated industry with real audit requirements, that pulls hard toward Sprinklr, where compliance tooling is a core product feature rather than something you'd build and certify yourself.
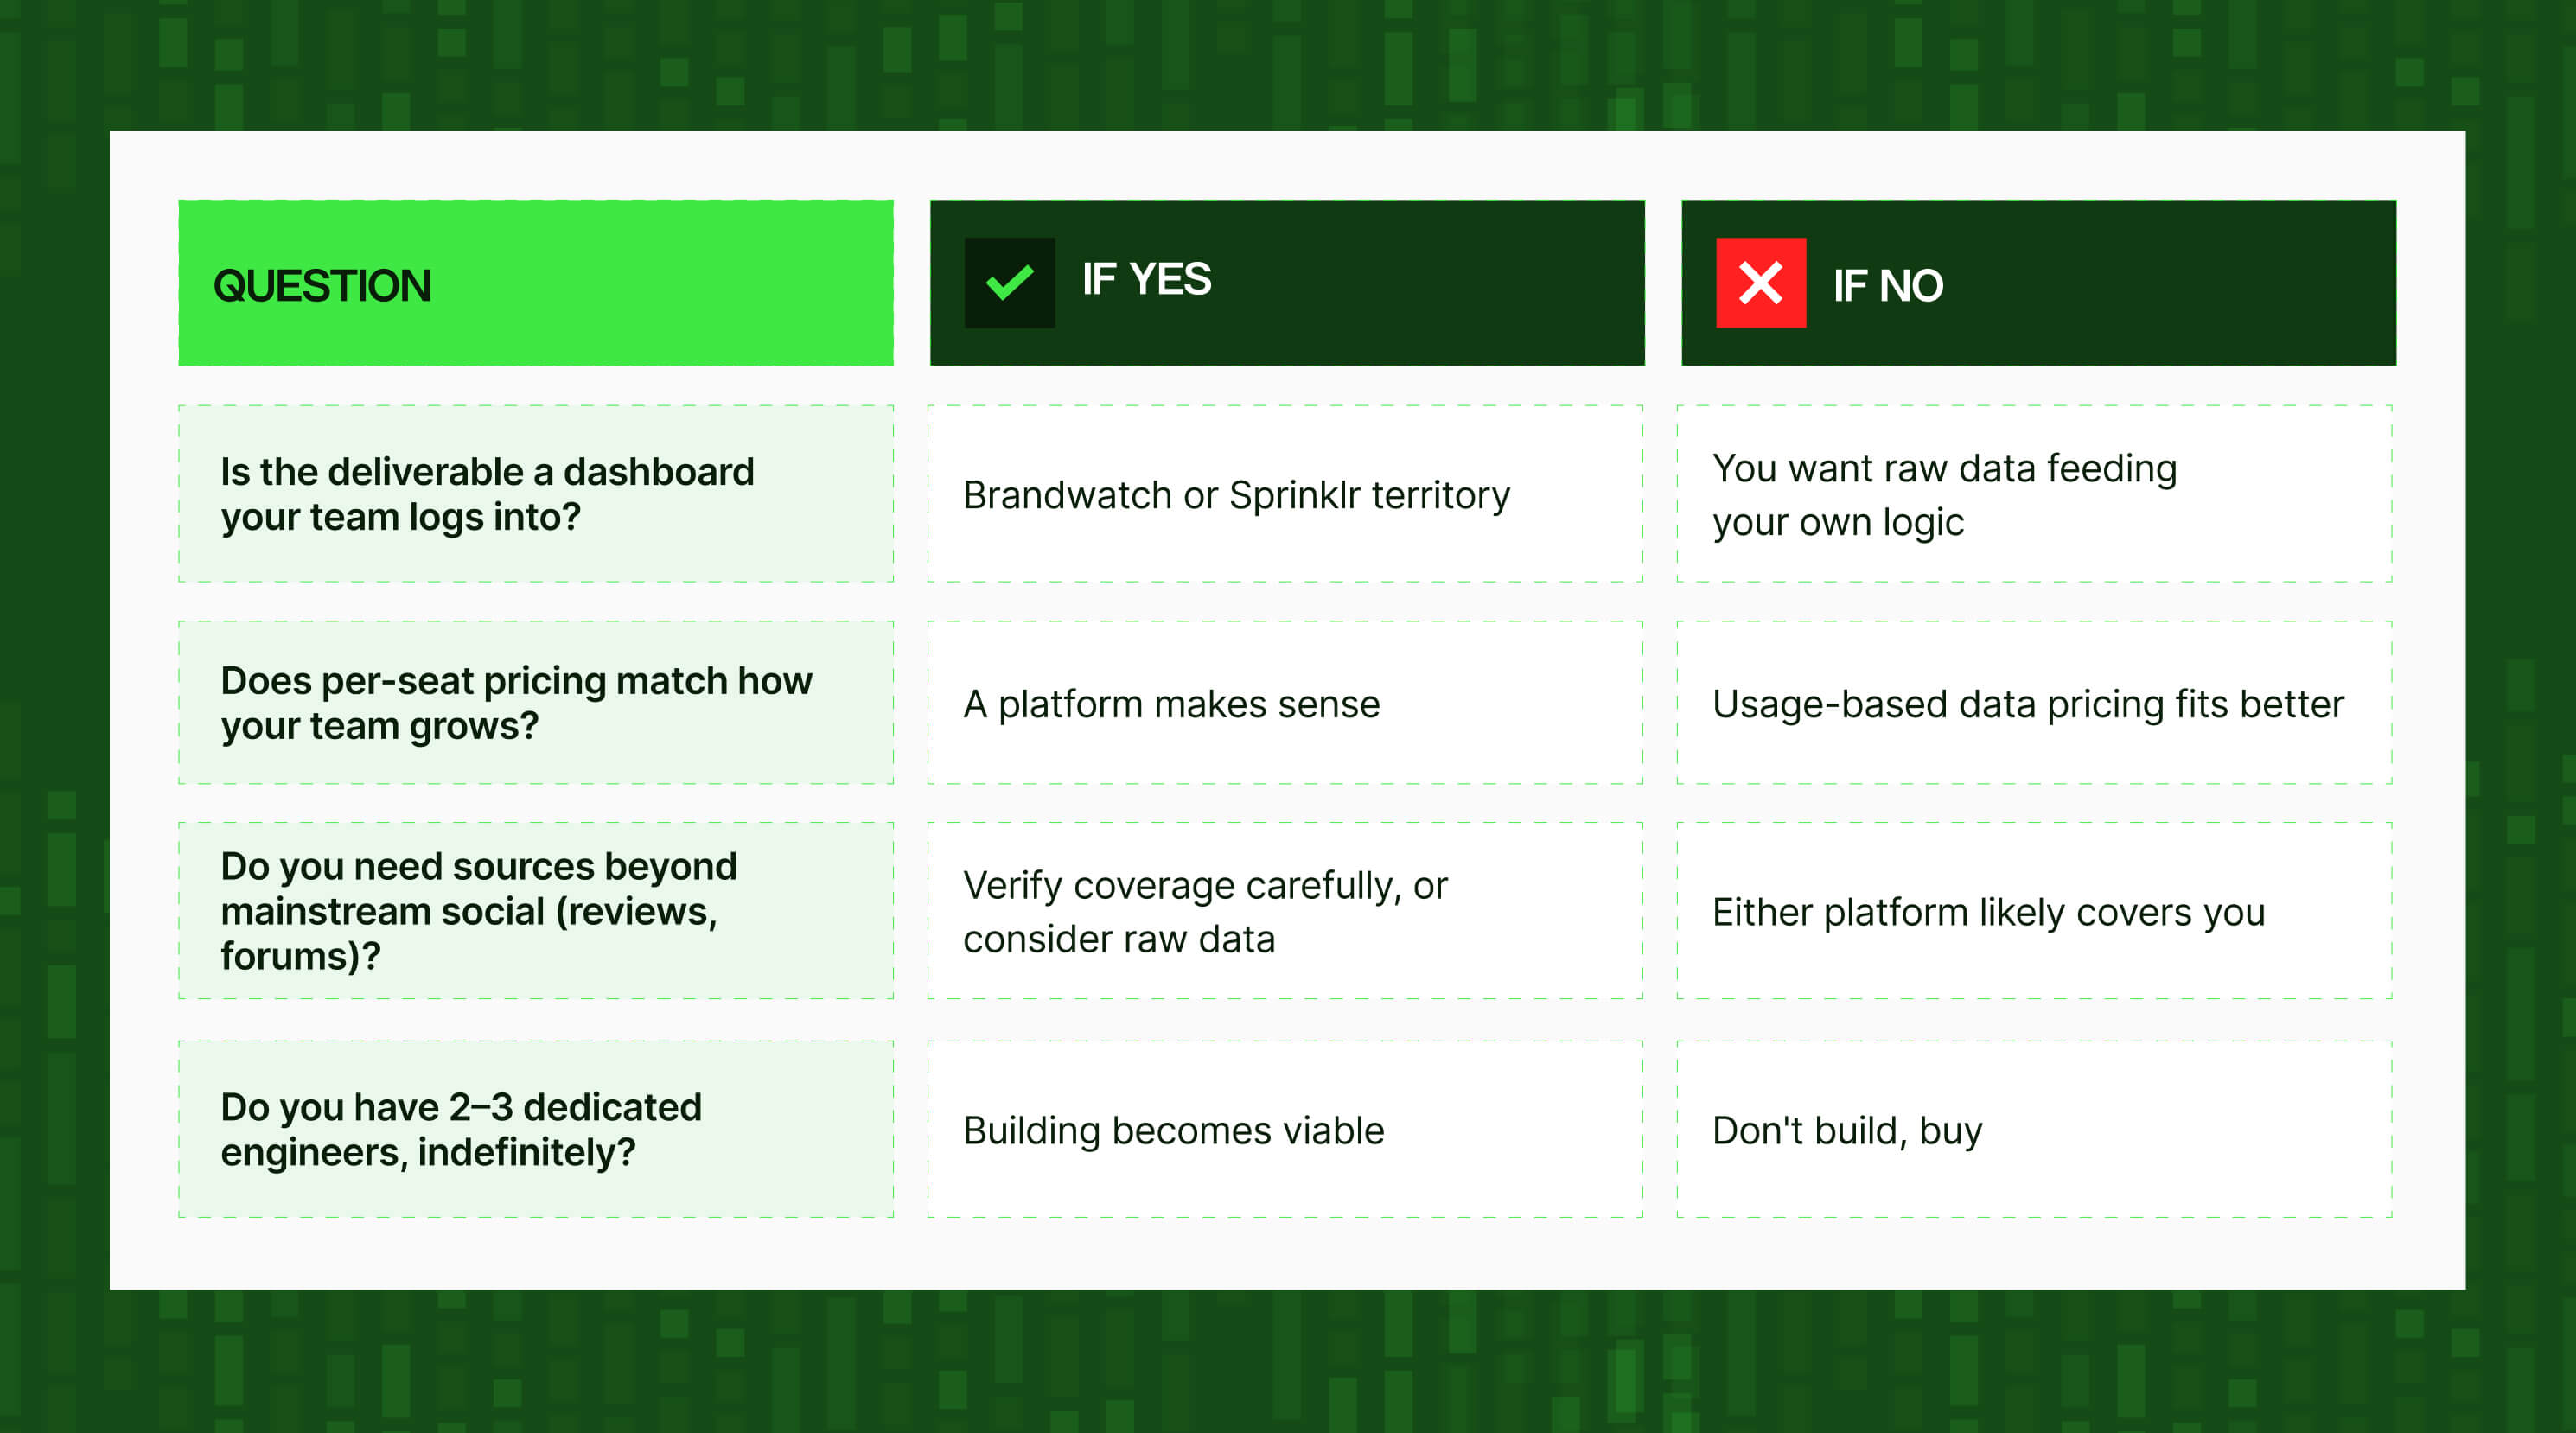
Which option is right for you: Brandwatch vs Sprinklr vs building your own data pipeline
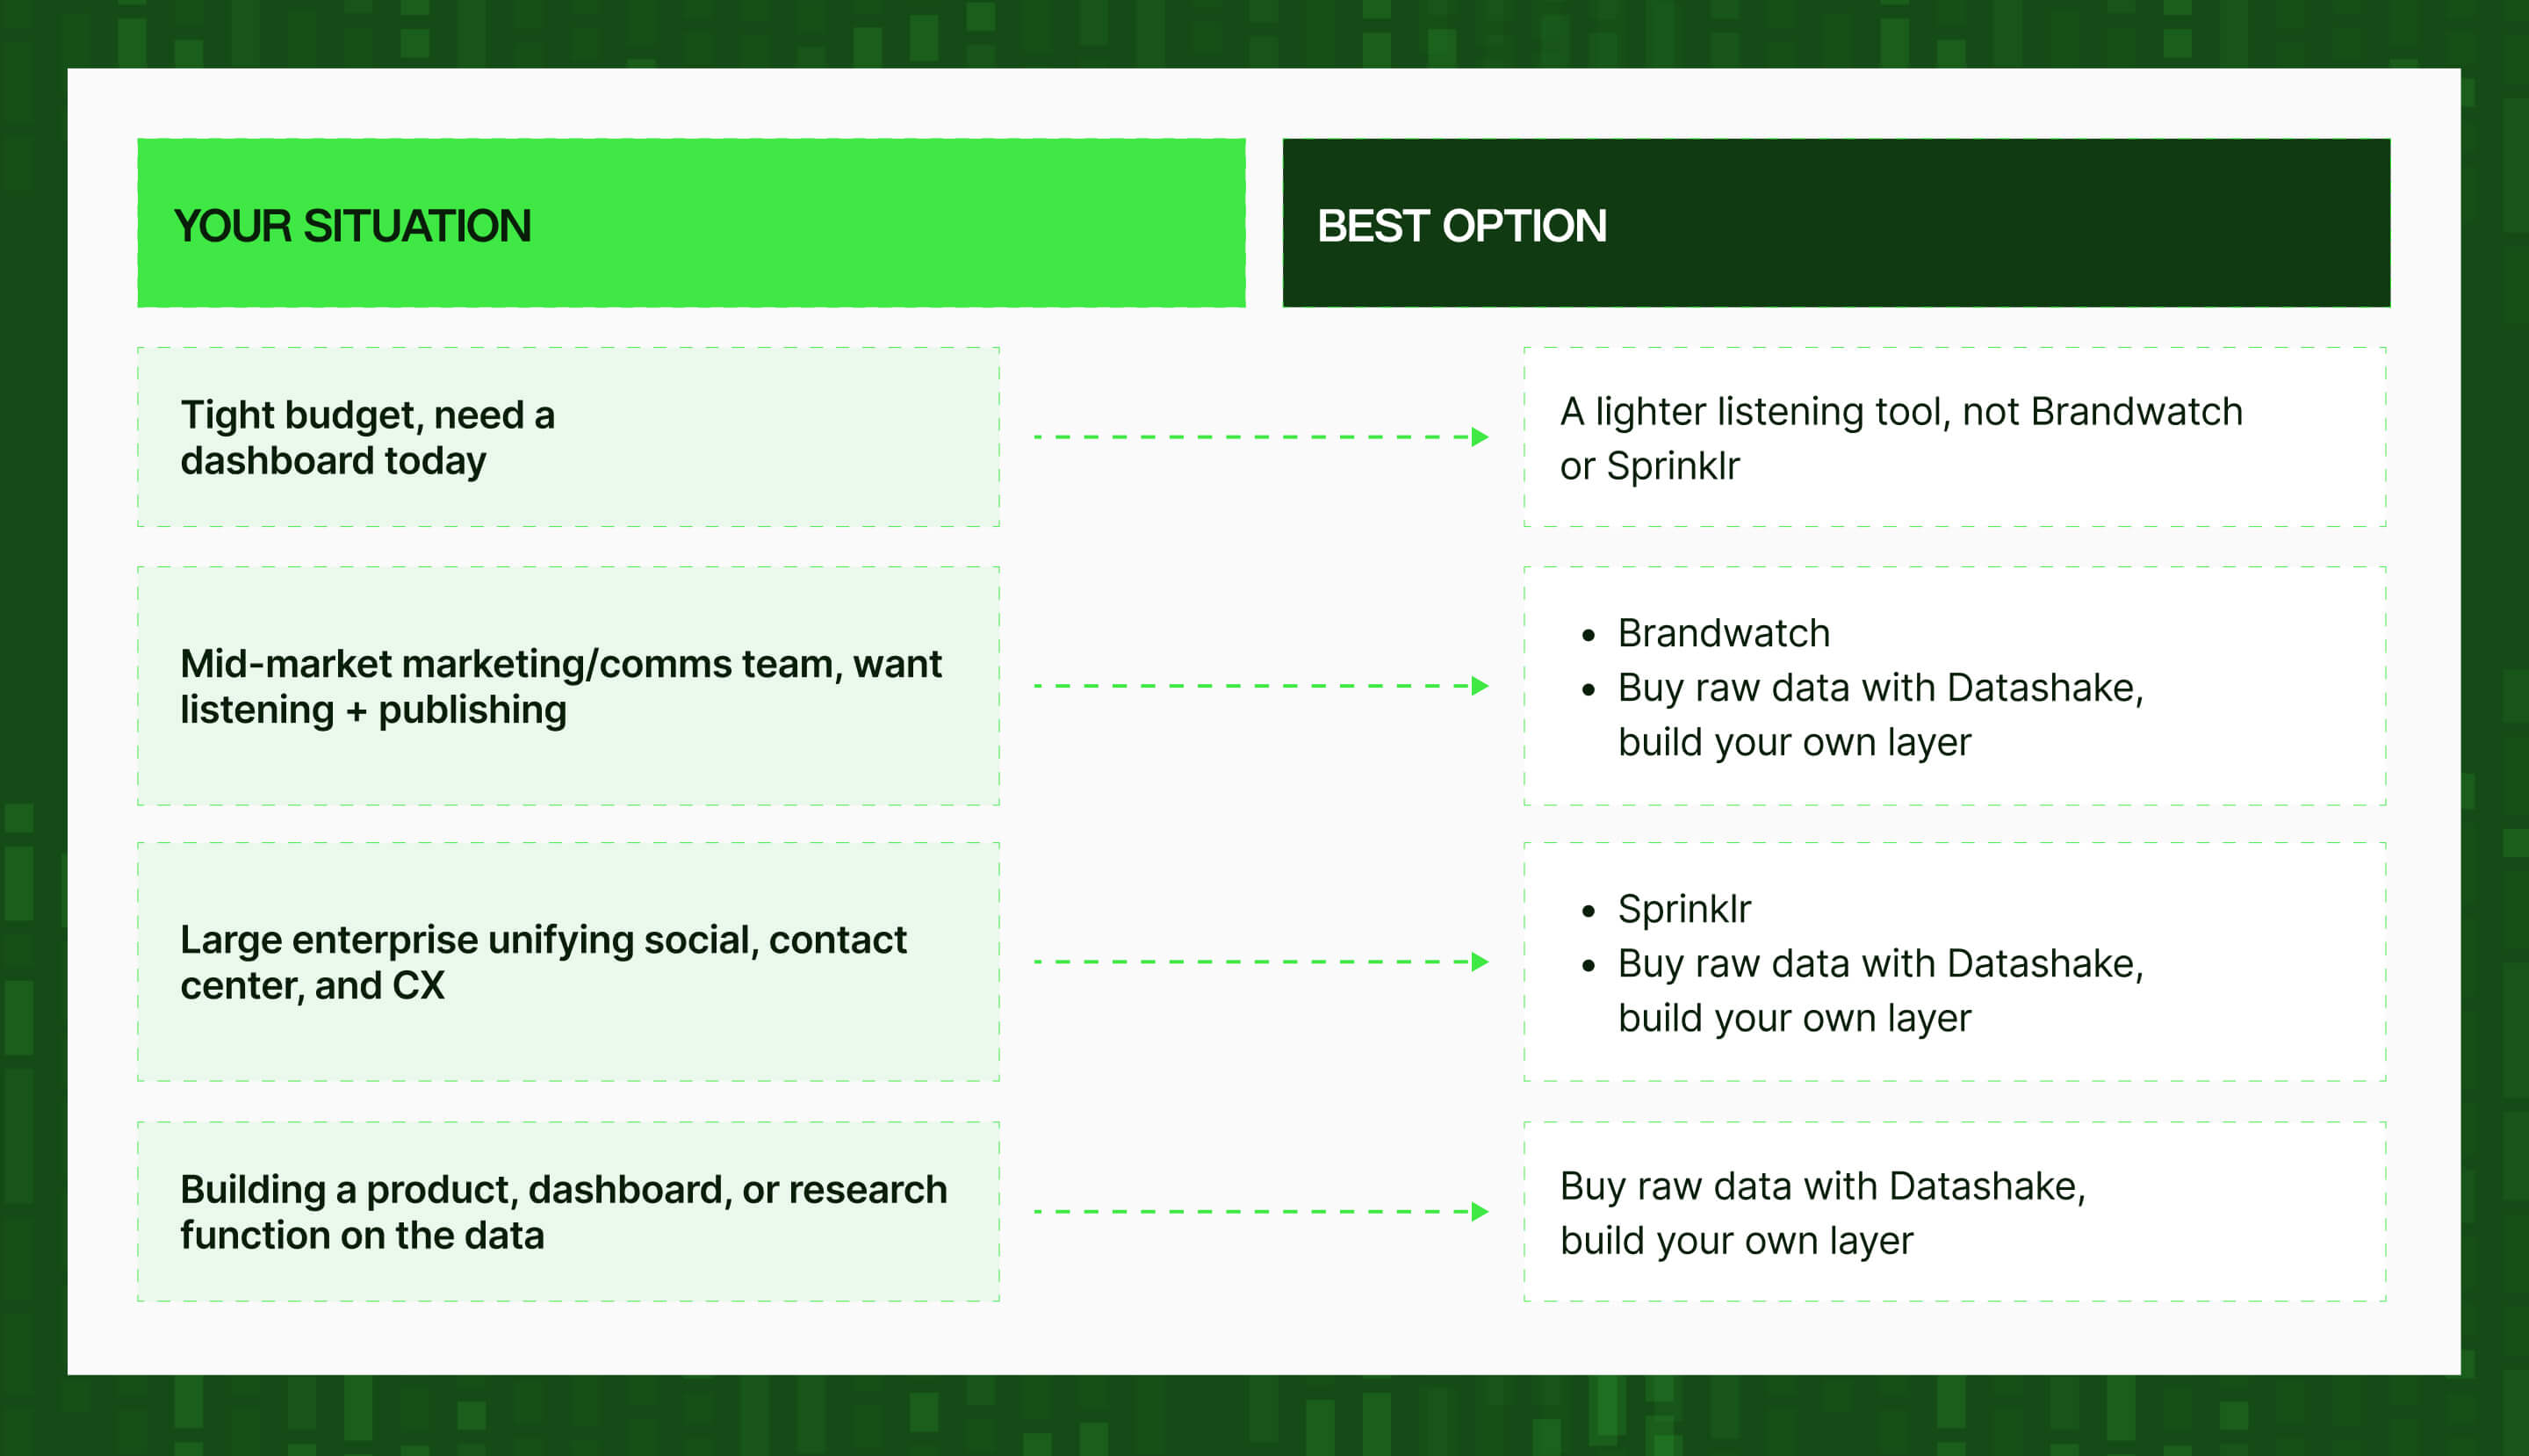
Run the numbers on your own coverage
Our 2026 Social Data Coverage Report benchmarks seven listening platforms and includes a five-question self-assessment for spotting where your own setup is likely leaking data.
Get the free report to see where you land, and how much more of the conversation a broader source list could put back in view. 👀
Frequently asked questions
What is social listening?
Social listening is the process of tracking and analyzing conversations about a brand across social media, review sites, and forums, used to monitor sentiment, spot trends, and understand what customers are actually saying. Brandwatch, Sprinklr, and most tools in this category are built around that core function, with publishing, CX, or raw-data layers added on top.
Is Brandwatch better than Sprinklr?
Neither is better across the board, they're built for different scales. Brandwatch is more accessible and more analytically focused, suited to mid-market marketing and comms teams. Sprinklr is broader and pricier, built for large enterprises unifying social with contact center and CX. Team size, budget, and whether you need CX functionality beyond listening should decide it.
How much does Brandwatch cost?
Brandwatch doesn't publish pricing. Based on buyer reports, expect roughly $10,000–$15,000/year at entry level, $20,000–$45,000/year for mid-market setups, and $60,000–$150,000+/year at enterprise scale, plus add-ons for dashboards, extra seats, and the influencer module.
How much does Sprinklr cost now that self-serve is gone?
Industry pricing trackers report that Sprinklr ended self-serve pricing on April 30, 2026 (unconfirmed by an official Sprinklr source at time of writing) and now sells primarily through enterprise sales. Entry contracts start around $50,000/year, the median contract is roughly $129,000/year, and full deployments run $26,000–$500,000+, plus $25,000–$150,000+ in year-one implementation costs.
Is it cheaper to build your own social data pipeline than to buy one?
Almost never, if you need broad, multi-platform coverage. A full build costs an average of $4.19M–$7.93M over three years and 9–15 months to production – more than either platform's enterprise pricing, before counting the maintenance burden that follows. It only pencils out when you have a proprietary collection need or data collection is your actual product.
What are the layers of a social media data pipeline?
Seven: data ingestion, data transformation, storage, orchestration, observability, activation, and governance. Most in-house builds underestimate the effort because they plan for ingestion and skip budgeting for the other six, which is where ongoing maintenance costs pile up.
Is it legal to scrape social media and review data?
Generally yes, for publicly accessible data that doesn't require logging in. hiQ Labs v. LinkedIn (2022) and Meta v. Bright Data (2024) both found that scraping public, unauthenticated data doesn't violate the CFAA. GDPR is the bigger constraint for EU-relevant data: you need a documented lawful basis and a way to honor objection rights, since public visibility doesn't exempt personal data.
Does US privacy law treat social media scraping the same way GDPR does?
No, it's meaningfully more permissive, at least today. Since 2023, California's CCPA/CPRA excludes information a business reasonably believes was "lawfully made available... by the consumer or from widely distributed media" from the definition of personal information, which covers most public social posts. GDPR takes the opposite position: public visibility doesn't exempt personal data at all, and you still need a documented lawful basis to process it.
Do Brandwatch and Sprinklr cover every social platform and review site?
No, neither can access more than what each platform's official terms allow, and both lean heavily toward mainstream social networks. Coverage gaps are common for niche forums, review sites, and platforms like TikTok, where no commercial API exists at all. Test your actual source list during a trial rather than assuming coverage from the marketing page.
Can review data actually predict customer churn before it shows up in usage dashboards?
To a meaningful degree, yes. Reviews can surface churn risk 4–8 weeks ahead of usage-based health scores – competitor mentions correlate with roughly 4x higher 60-day churn, and going quiet correlates with a 3.2x higher 30-day churn rate. It requires building your own model on raw review data, though; it's not a standard feature in Brandwatch, Sprinklr, or most listening dashboards.
Can I get LinkedIn data through an official API?
Not for company or post data at any meaningful scale. LinkedIn offers six official APIs, but they're either invite-only for HR and ad partners or limited to your own profile data; there's no approved path for third-party data extraction, and the unofficial internal API gets accounts banned within days if used that way.
What's the difference between a social listening platform and raw social data infrastructure?
A listening platform bundles data collection with a dashboard and seats, priced per user. Raw data infrastructure sells just the normalized data itself, via API, priced by usage – leaving you to build or buy the enrichment, analysis, visualization, and workflow layers yourself. The right fit depends on whether your team needs a dashboard to use, or data to build something with.
.png)



More insights you might like
%20Access.jpg)