How to Combine Social and Review Data with Quantitative and Qualitative Research
Every insights team wants the same thing: findings solid enough to make a decision on.
But getting there is a lot harder than it used to be. Surveys face falling response rates and fraudulent respondents. A lot more research is being simulated by AI, and social data has hefty blind spots of its own.
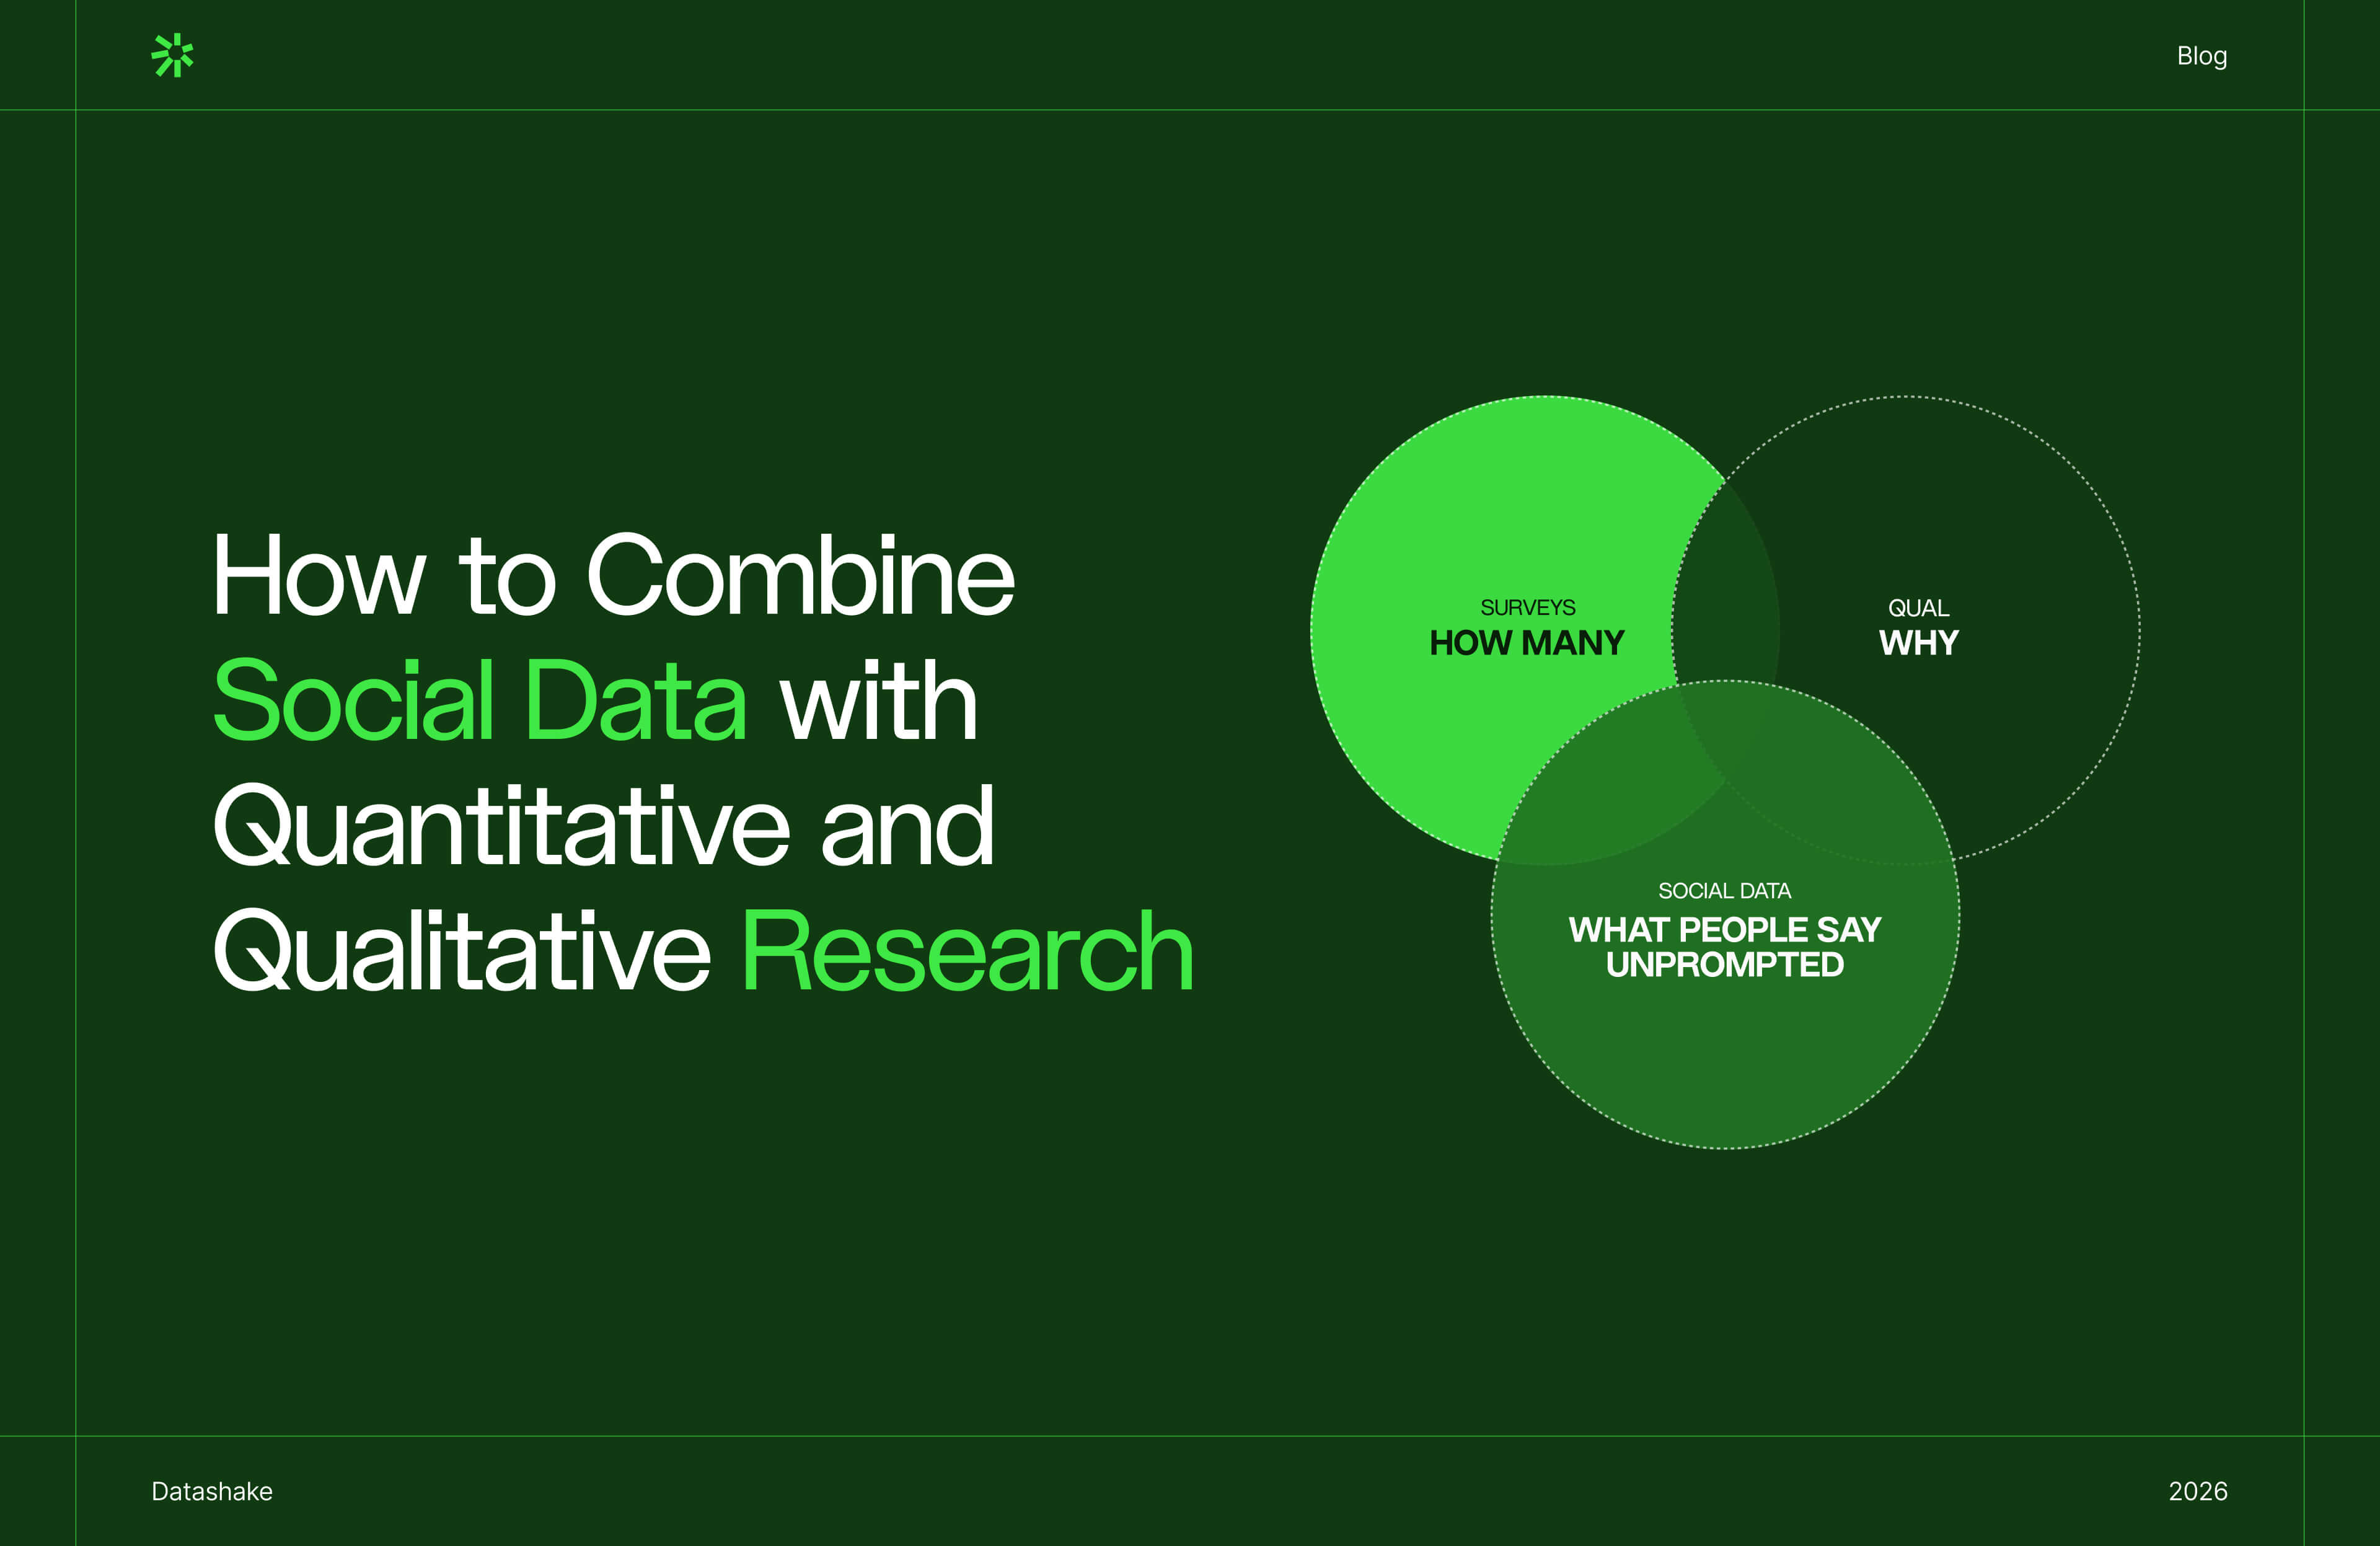
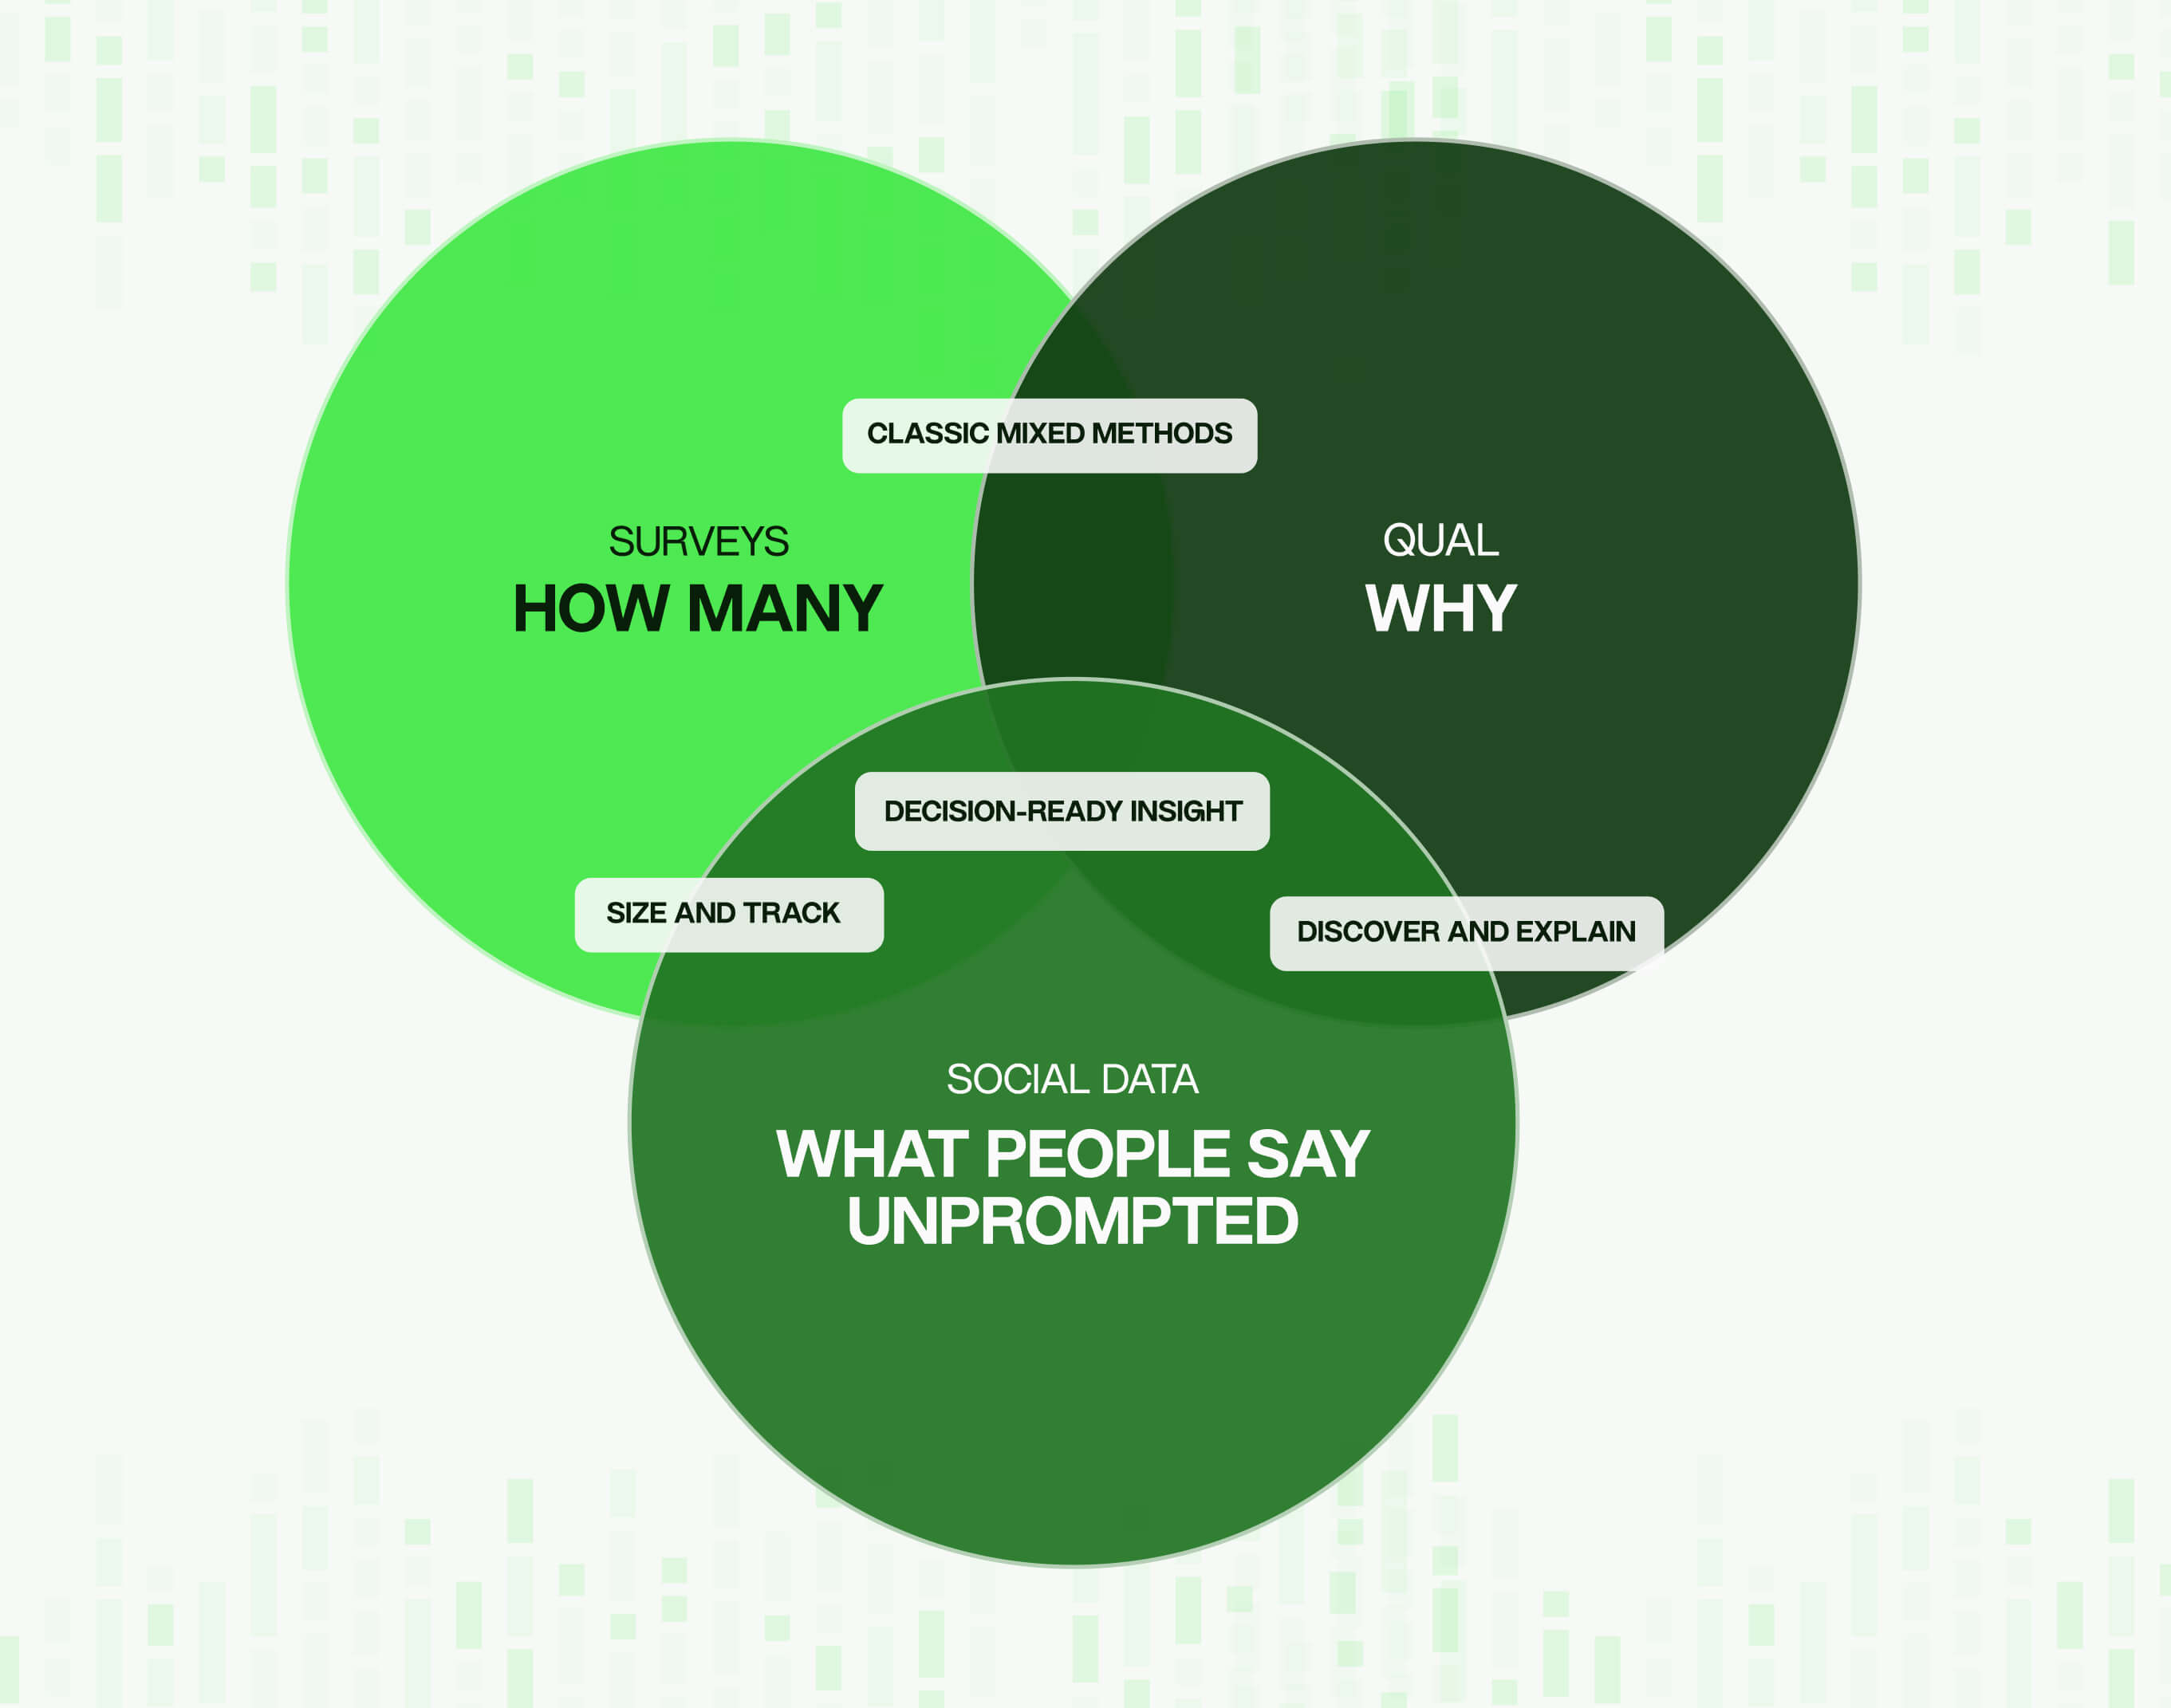
No source can carry the weight on its own any more; different sources need to be combined. Surveys tell you how many, interviews and focus groups tell you why, and social data tells you what people say when nobody's asking.
When the three agree, you can act with confidence. When they don't, you've found something worth looking into.
The trouble is these often sit in separate workstreams, with social listening in its own dashboard, and the findings never quite meet.
This guide shows how to combine social data with quantitative and qualitative research so the three work as one system. ⬇️
What you'll learn
- Why social data counts as both qual and quant, and why that makes it useful between the two
- A research-backed framework for combining different kinds of data
- Seven practical ways to combine social data with surveys, interviews and focus groups
- How to prepare your data so the three sources can be compared
- How closely social data tracks survey results, and how to correct for its skew
- Why reviews are the most useful source for combined research
- A 30-day plan to run your first combined study
Quick answer
To combine social data with quantitative and qualitative research, decide which source leads, code survey open-ends, interview transcripts and social posts with one shared codeframe, and compare the findings side by side. Social data is the bridge: you can count it like a survey and read it like an interview.
Is social media data qualitative or quantitative?
It's both. A single post is qualitative: unstructured text in someone's own words. Thousands of posts, coded by theme, sentiment or topic, become quantitative data you can count and track over time. That's why social data can connect surveys, which tell you how many, with interviews and focus groups, which tell you why.
Researchers call the process of turning qualitative material into numbers quantitizing. It's less simple than it sounds: a 2009 paper by Sandelowski, Voils and Knafl points out that converting words into numbers involves judgements and compromises that often go unexamined, and a constant balancing act between numerical precision and the richness of what people truly said.
Social data asks you to do both at once. If you treat it purely as numbers, you end up with mention counts and sentiment scores that explain nothing. But treat it purely as text and you have a few memorable quotes and no idea how common they are.
Get both halves right and it becomes one of the most flexible sources you have.
Social data vs surveys vs focus groups: what each does best
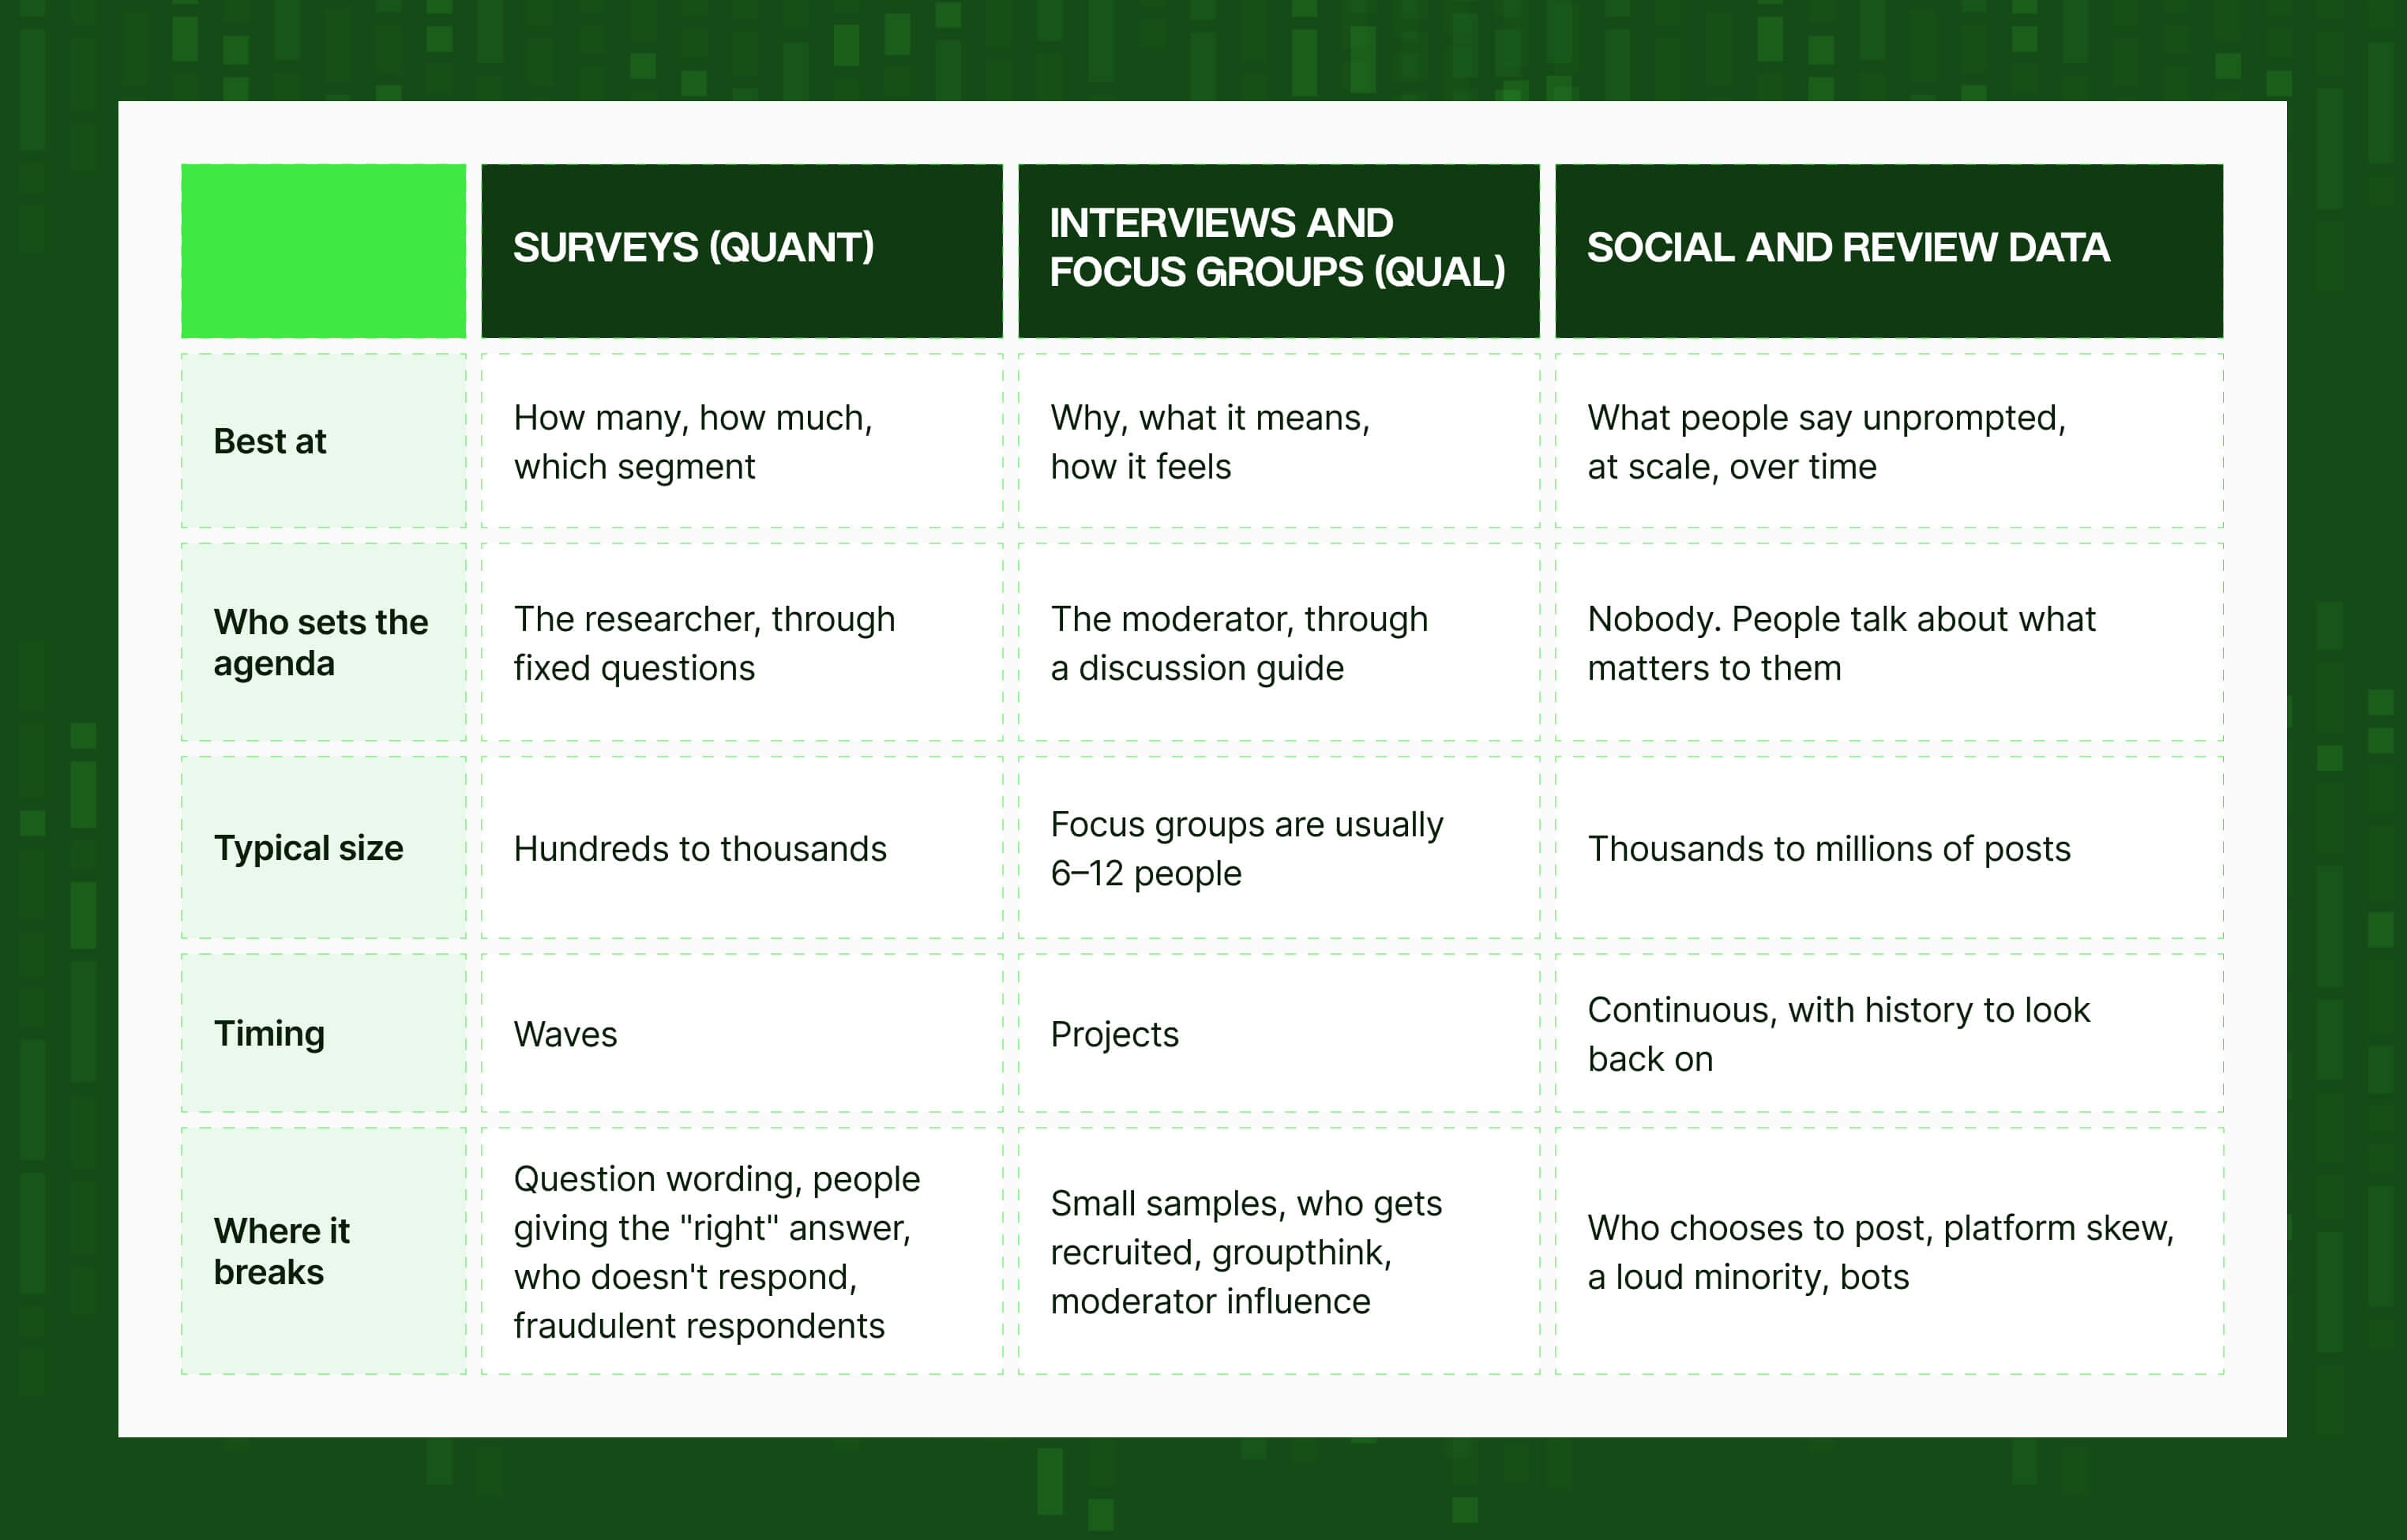
Surveys are best at measuring how many people think or do something. Focus groups and interviews are best at explaining why. Social data is best at showing what people say unprompted, at scale and over time.
Each one gets things wrong in a different way. A finding that holds up across three different kinds of error is far more trustworthy than one you reached three times with the same tool.
We've written about how surveys and social data fail in opposite directions in our guide to stress-testing survey findings. Bringing qual into the picture adds the chance to ask "why?" and follow up on the answer.
Why combine social listening with traditional market research?
Because every source is harder to rely on alone than it used to be.
Survey response rates have fallen sharply and online panels face fraud, more research is being simulated by AI, and social data has blind spots of its own. Combining them lets each source check the others.
Surveys are under more pressure than ever
At Pew Research Center, the response rate for a typical phone survey was 36% in 1997. By 2018 it was 6%.
Online panels brought scale back, and brought fraud with it. A 2026 NORC research brief on bots and fraudulent respondents cites work finding usable responses in some online surveys falling from roughly 75% to 10% in recent years.
Surveys still answer questions nothing else can, but a survey result you can't cross-check is a bigger gamble than it used to be.
More research is being simulated
Qualtrics' 2026 Market Research Trends report, based on more than 3,000 researchers in 14 countries, found only 15% use AI agents today, while nearly 80% expect agents to run more than half of research projects end to end within three years.
The more research is generated by models, the more you need data that real people produced with no connection to your study. Social data is a large source of exactly that, which is also why it's becoming such a valuable AI training asset.
Social data needs structure around it
Social data has blind spots too, and access to it keeps changing. Meta shut down CrowdTangle in August 2024, for example, and its replacement is limited to academic and nonprofit researchers. It does its best work when surveys and qual give it a frame, and its worst when it's asked to carry a big decision alone.
If you're not sure what your current feed is missing, start with why social media data is often incomplete.
What is mixed-methods research, and where does social data fit?
Mixed-methods research combines quantitative data, such as survey results, with qualitative data, such as interviews, in one study and brings the findings together. Social data fits naturally because it's both: you can count it and you can read it.
How to integrate qualitative, quantitative and social data: 3 levels
"Combine your sources" is easy to say, but in practice, you can steal an approach from healthcare research: Fetters, Curry and Creswell's 2013 paper on integrating mixed-methods data.
It splits integration into three levels, and each one translates neatly to social data ⬇️
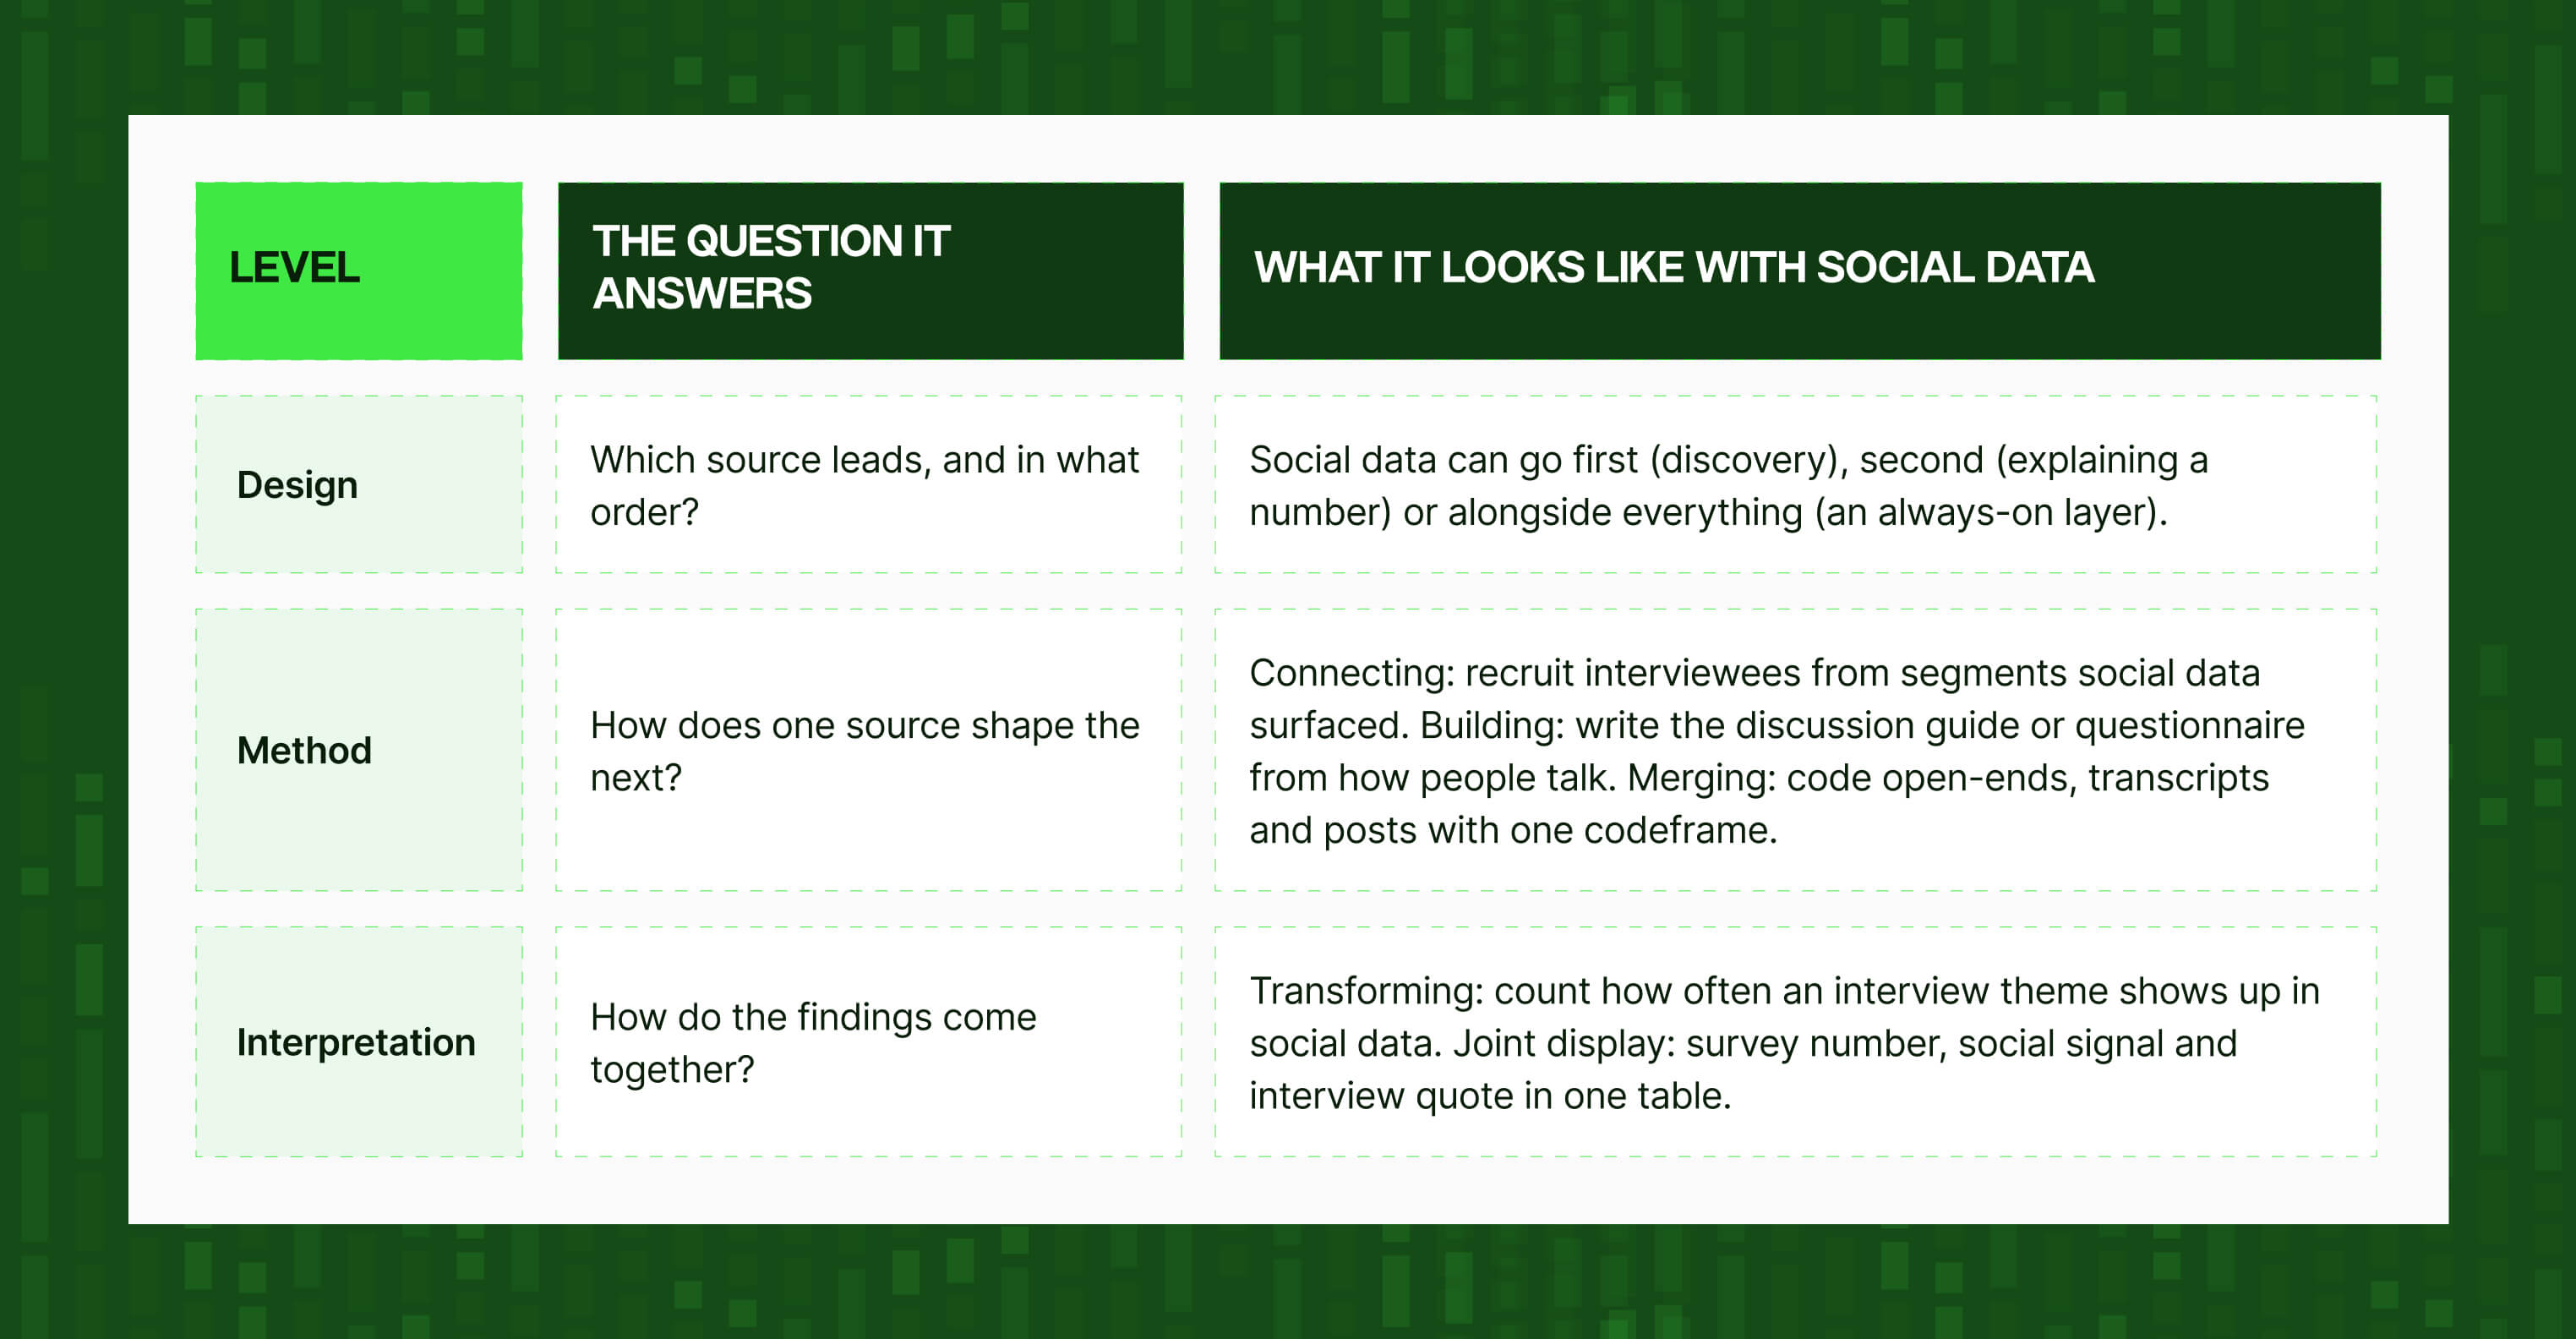
The paper also gives us a handy word: fit. Fit describes how well findings from different sources hang together. The paper names three outcomes: the findings confirm each other, they expand on each other by covering different sides of the same issue, or they contradict each other. Each outcome tells you something, as long as you say which one you've got.
This isn't a healthcare model bolted onto marketing, either. A review of qualitative and mixed-methods social media research found that many studies combining qualitative and quantitative social media data followed these same basic designs.
Which research source should lead?
The source that leads depends on your question.
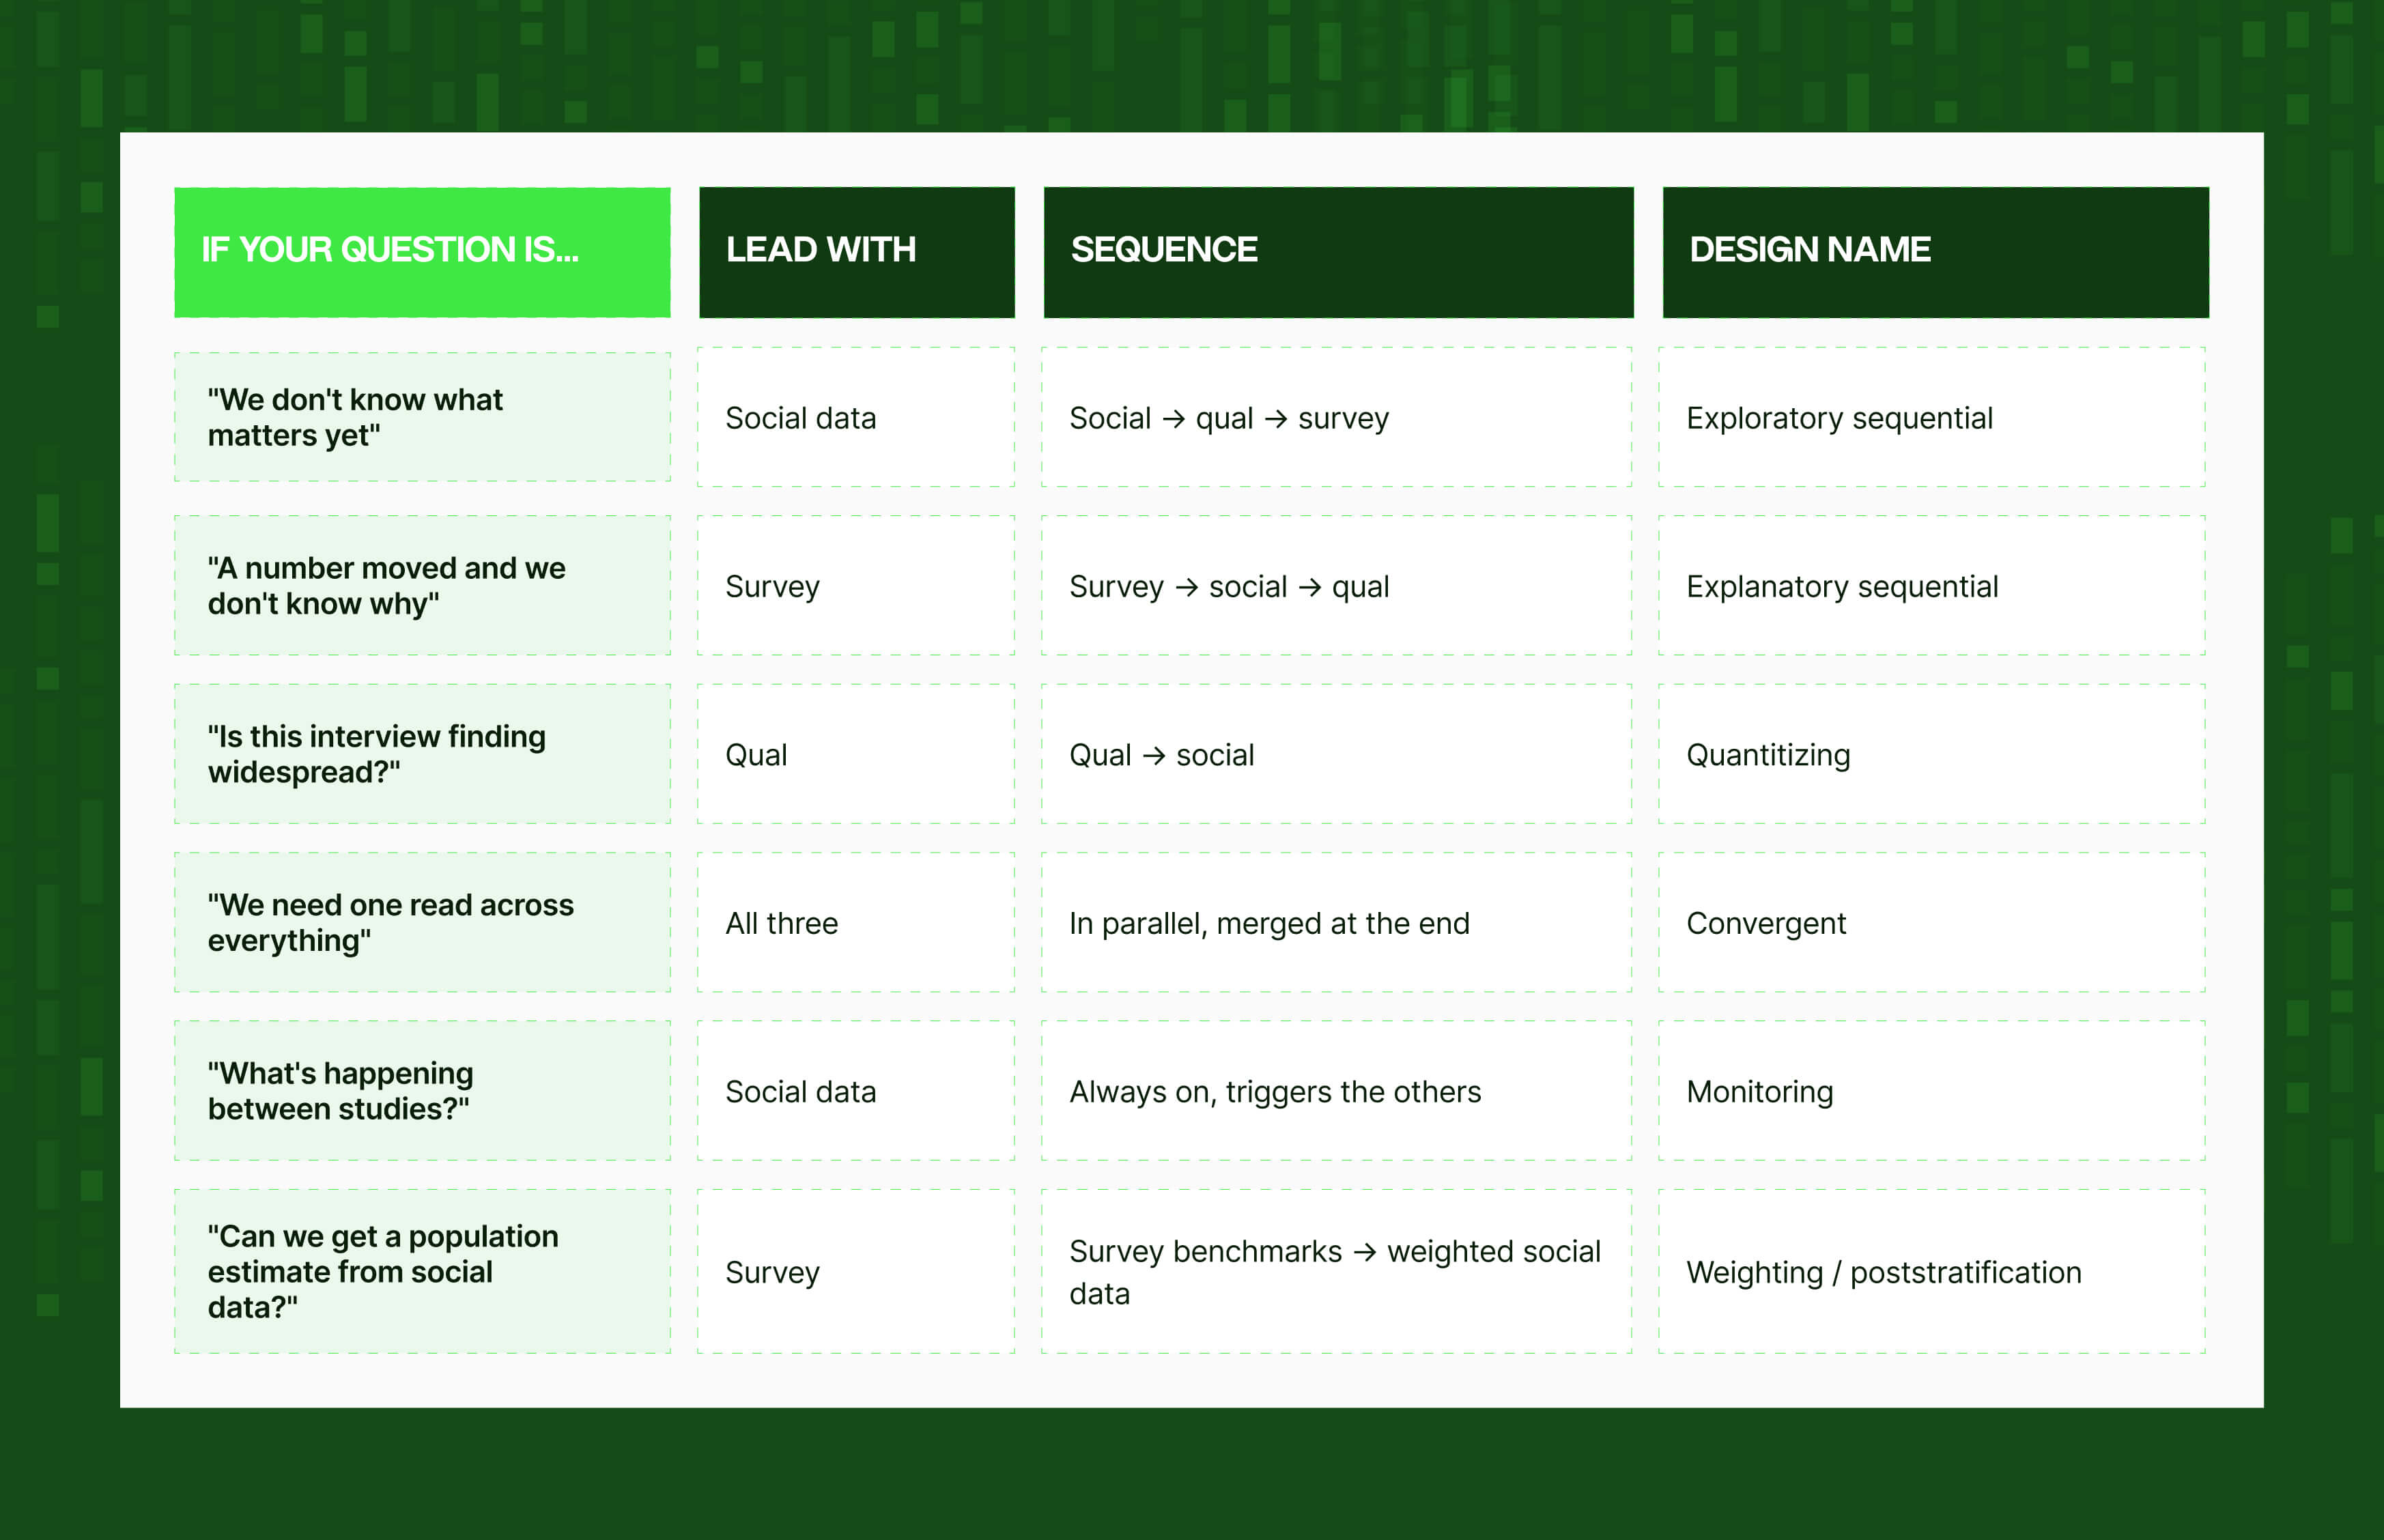
Lead with social data when you don't yet know what matters, with a survey when a number has moved and you need to know why, and with qual when you need to know how widespread a finding is. Start from the question, not from whichever data you have to hand.
7 ways to combine social data with surveys, interviews and focus groups
There are seven practical ways to combine social data with surveys, interviews and focus groups: use social data for discovery, write better survey questions, explain why a metric moved, measure how common an interview finding is, link the same people across sources, monitor between survey waves, and correct social data's skew.
1. Start with social data before you speak to anyone
Direction: social → qual → survey
Use it when: you're going into a new category, audience or problem and don't yet know what matters.
Before you write a discussion guide, spend time with what people are already saying. Look for how they describe the problem, what they compare you with, uses you didn't expect, and the words that keep coming back.
It's a lighter version of netnography, the approach Robert Kozinets set out in the Journal of Marketing Research for studying online communities as a source of consumer insight.
- Pull a few months of social and review data on the topic, not only your brand.
- Read a few hundred posts properly before you code anything.
- Note the themes, tensions and vocabulary that keep coming up.
- Build your discussion guide from what you found, and recruit from the groups that surfaced.
Interview time is expensive. Spending it on questions public conversation could have answered is a waste. If you're not sure where your audience talks, this comparison of TikTok and Reddit communities is a good place to start.
2. Use social language to write the questionnaire
Direction: social (+ qual) → survey
Use it when: you're designing or refreshing a survey.
The way customers phrase things in public gives you better wording, answer options you'd have missed, and topics you hadn't thought to ask about.
We walk through it in the sharper survey questions section of our stress-test guide.
3. Explain a number that changed
Direction: survey → social → qual
Use it when: a tracker metric shifts and nobody can say why.
Look at social and review data for the weeks around the shift and list the possible explanations. Then run a small, fast round of qual to find out which one holds up. The numbers come first and everything after explains them, which is why it's called an explanatory sequential design.
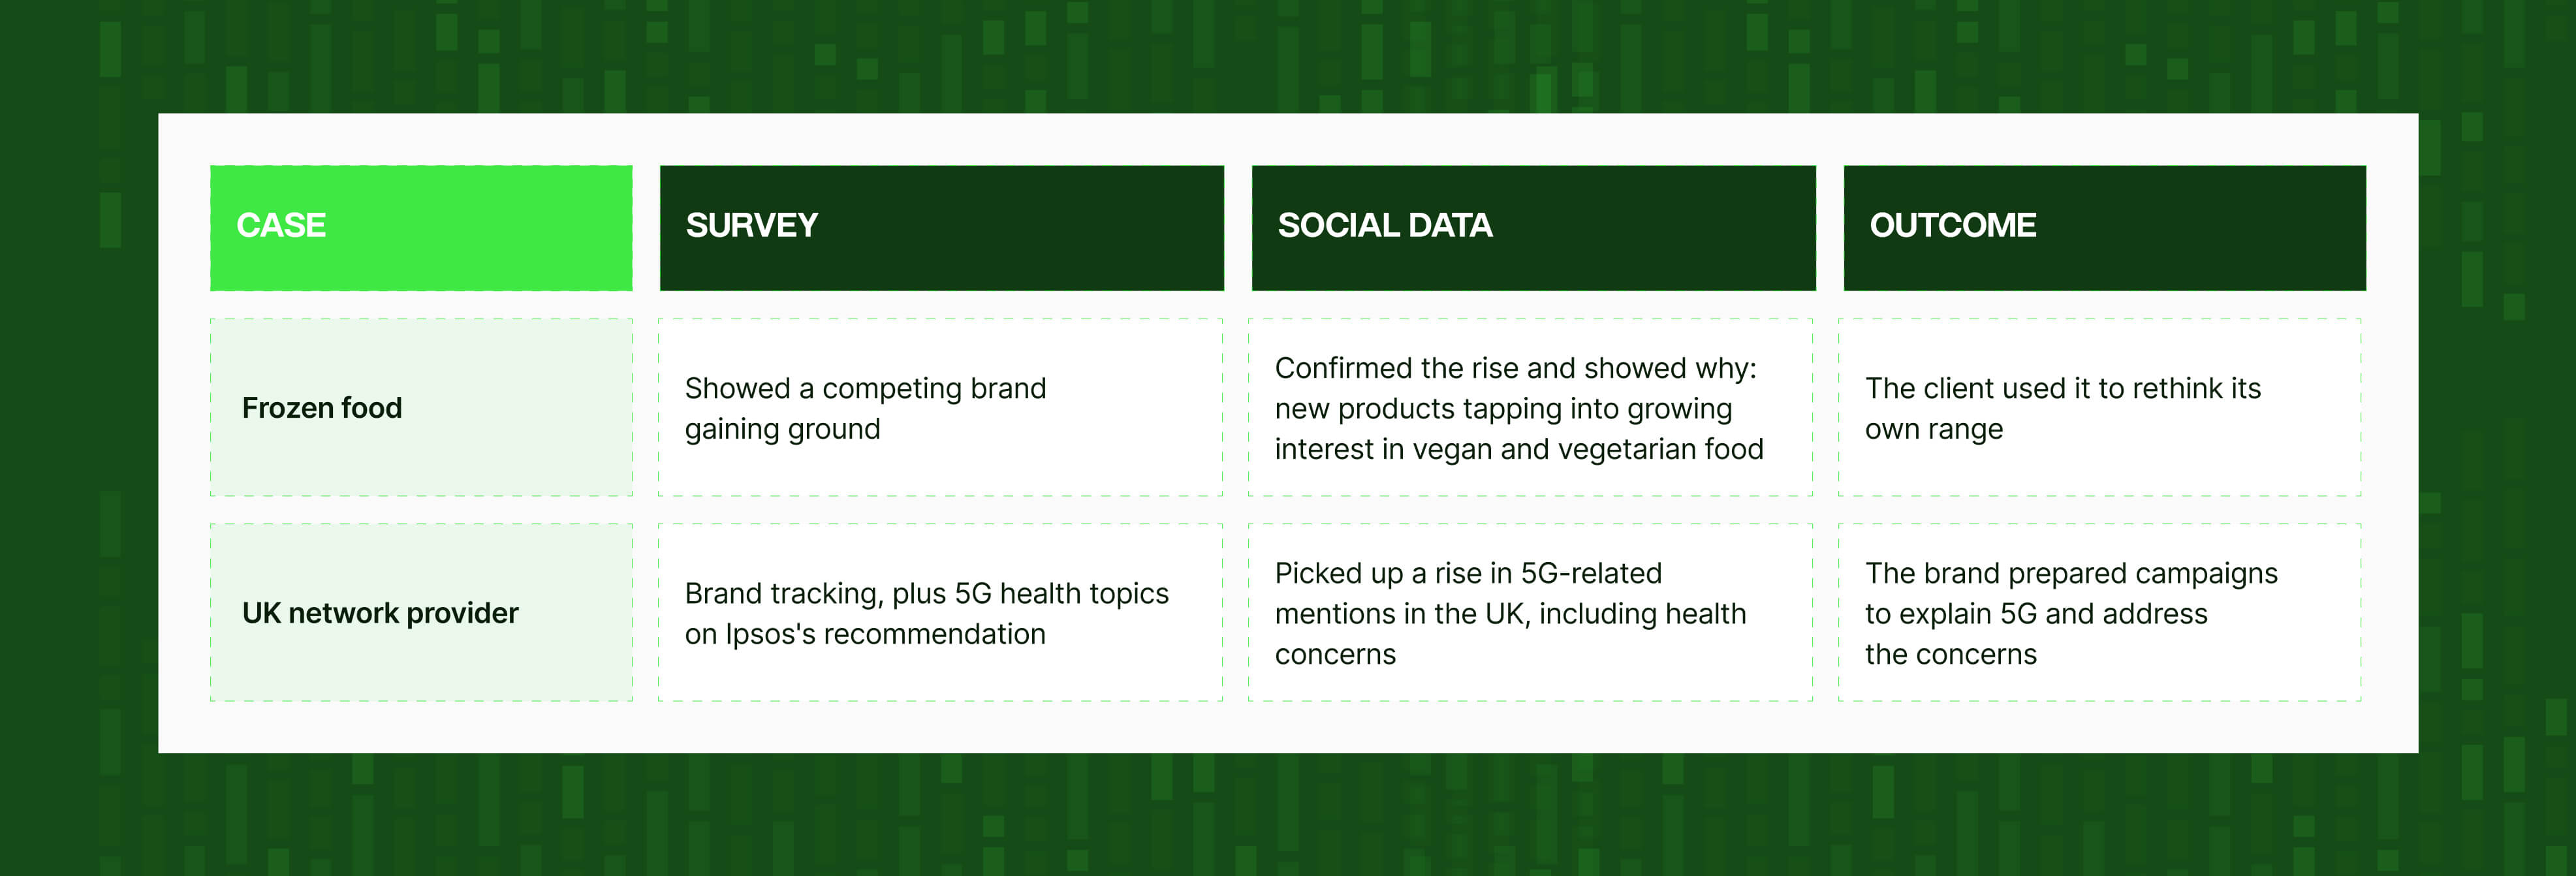
Research agencies already work like this. Ipsos combines brand-tracking surveys with social data in a product called Brand Signals, and its published case studies show how:
- In one case, a competing frozen-food brand was gaining ground in the client's survey. Social data confirmed the rise and showed what was driving it: new products that tapped into growing interest in vegan and vegetarian food. The client used that to rethink its own range.
- In another, Ipsos recommended a telecoms brand track health concerns about 5G through both social data and its survey, so the brand could prepare campaigns that addressed them.
4. Measure how common an interview finding is
Direction: qual → social
Use it when: interviews surfaced a theme and you need to know whether it's widespread or growing.
Interviews are great at finding themes and bad at telling you how common they are.
So take the codeframe from your interviews and apply it to social and review data. You'll see how often each theme appears, where, and whether it's growing.
One catch: posts aren't people. Pew Research Center found that the most active 10% of US adult Twitter users wrote 80% of the tweets. Pew's data team has written about exactly this problem: count posts and a single prolific account can make a niche topic look like a national obsession.
Count unique authors instead, and describe the result for what it is. ✅ "A third of people discussing the change mention texture" is accurate. ❌ "A third of customers dislike the texture" isn't.
5. Link the same people across sources
Direction: survey ↔ social, person by person
Use it when: you need to compare what someone tells you in a survey with what the same person says in public.
You ask survey respondents for permission to look at their public social accounts, then analyse their answers and posts together. Pew did exactly this for its 2019 study of Twitter users.
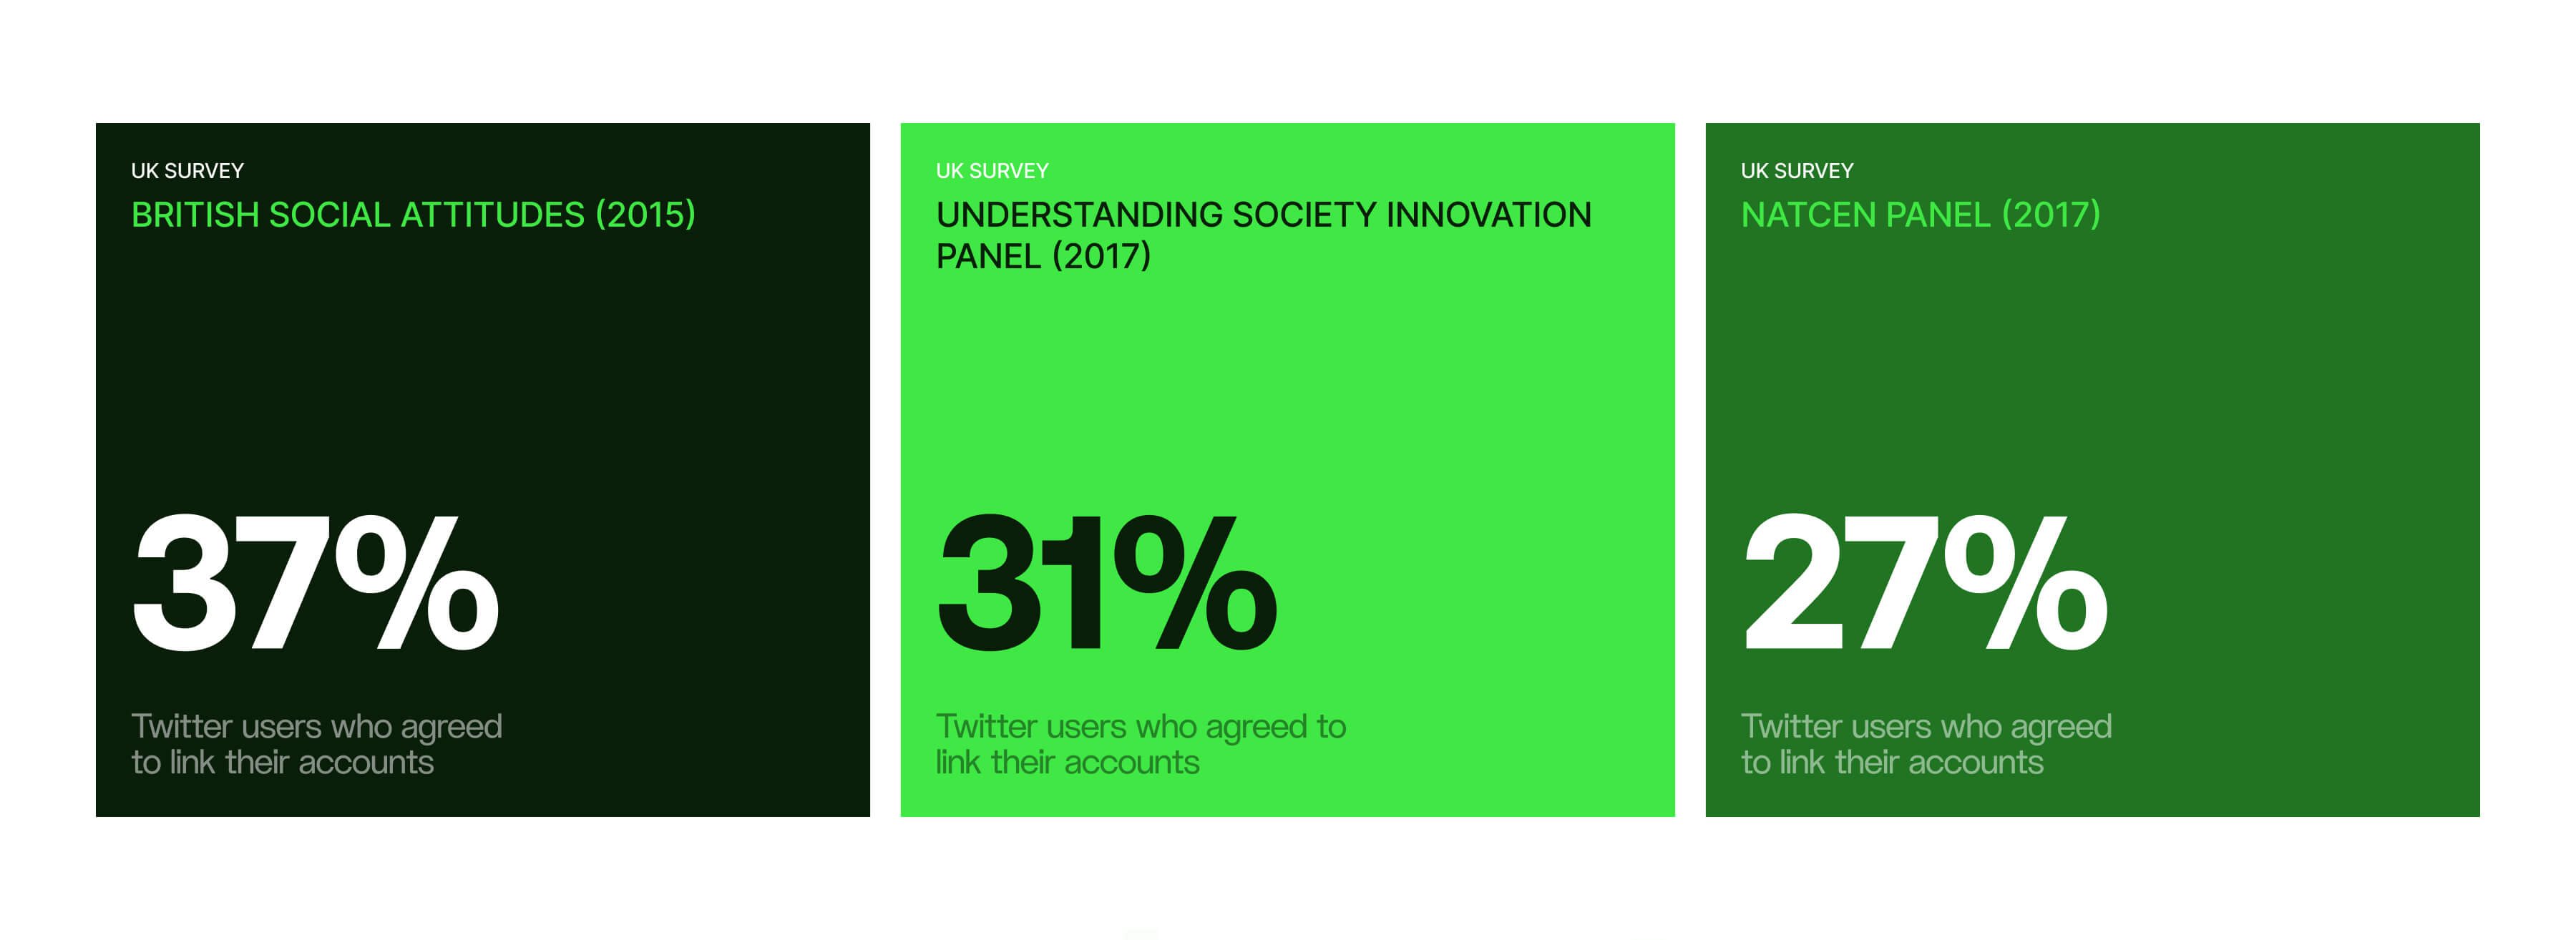
The sticking point is consent. A review of UK surveys found that between 27% and 37% of respondents who used Twitter agreed to have their accounts linked. Younger people agreed less often in two of the surveys, and people answering online agreed less often than those asked by an interviewer.
Treat linked data as a close-up of one group instead of a population estimate.
6. Keep watch between waves and projects
Direction: social alongside everything
Use it when: your research runs in waves or projects and you need to know what happens in between.
Social data runs continuously and you can look back through its history, so it makes a natural early-warning layer. A spike can trigger a quick round of interviews as well as an early survey wave.
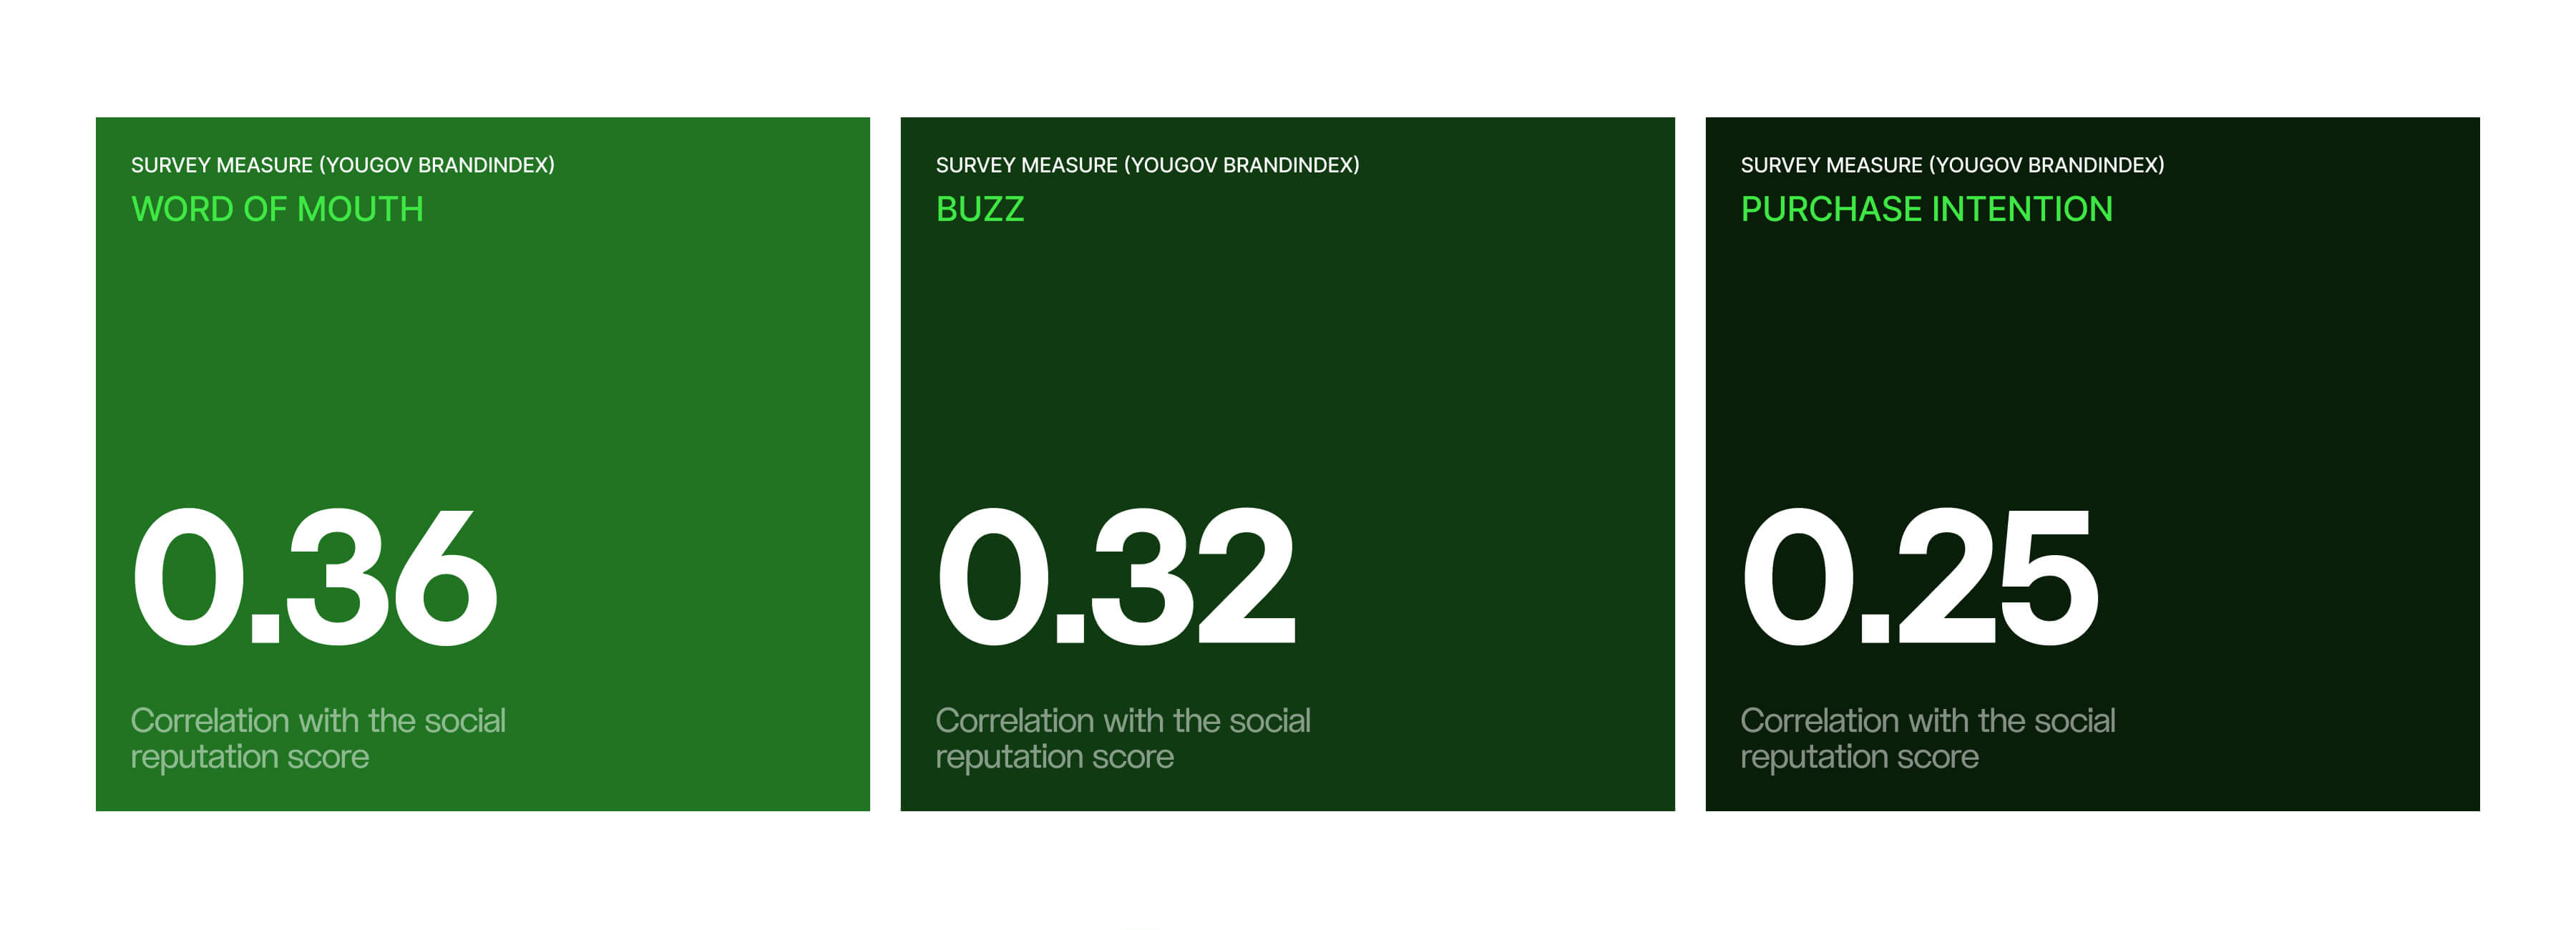
How closely do social and survey measures move together? A large-scale answer comes from a 2021 Journal of Marketing study by Rust and colleagues. They built a weekly brand reputation tracker from Twitter data for 100 global brands and compared it with YouGov's survey-based BrandIndex for 71 of them. The social measure correlated with survey measures of word of mouth (0.36), buzz (0.32) and purchase intention (0.25), and earlier reputation scores helped predict later purchase intention.
So the two are clearly related, and social data can hint at where a survey is heading. They're also a long way from interchangeable, which is exactly why you want both.
7. Use surveys to correct social data's skew
Direction: survey → social
Use it when: you want a population-level estimate from social data and you know, at least roughly, who is in it.
Skewed data isn't automatically useless. A well-known demonstration is the Xbox study by Wang, Rothschild, Goel and Gelman. Before the 2012 US presidential election they polled 345,858 Xbox users, 93% of them men and 65% aged 18 to 29. Taken at face value, the results were badly skewed. After adjusting them with a statistical method called multilevel regression and poststratification (MRP), the final national estimate came within 0.6 percentage points of the actual result.
For combined research, the lesson is that a representative survey gives you the benchmark to correct a skewed source. If your social data tells you something reliable about who is posting (platform, region, segment), you can weight it towards the population your survey describes.
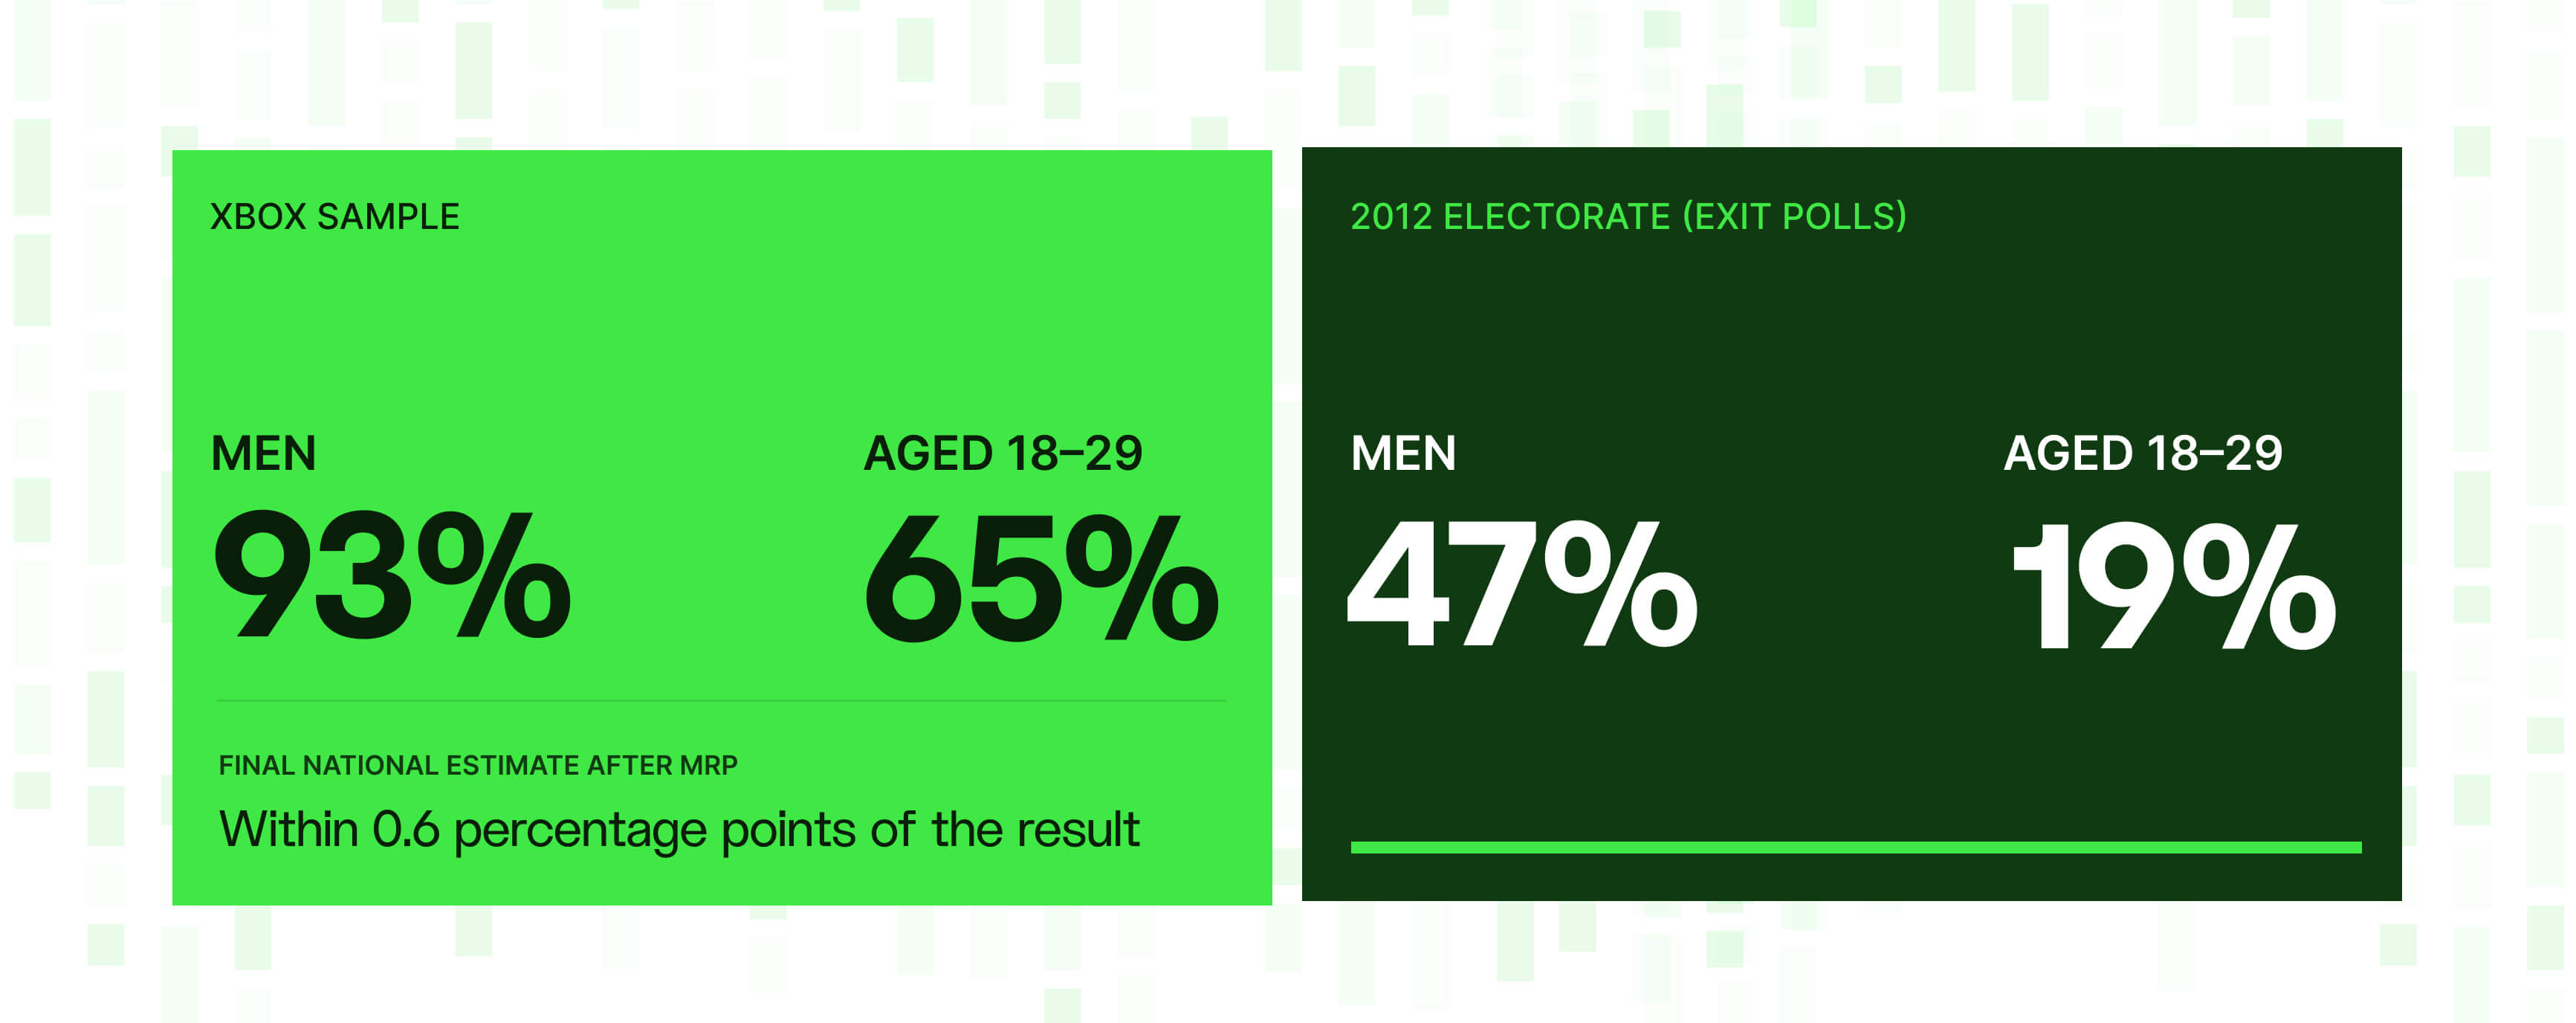
A caveat: Xbox respondents answered demographic questions. Social data doesn't tend to come with reliable age or gender, so full MRP is rarely possible. Simpler options still help, such as weighting by platform or reporting each platform separately rather than blending them. Whatever you do, write your assumptions down and share them with the results.
How to use online reviews in combined research
If social data is both qual and quant, reviews are the clearest example of it. A typical review pairs a star rating (a number) with the customer's reasons in their own words (text), plus a date. The "how satisfied" and the "why" arrive in the same record.
That makes reviews the easiest place to start combining sources:
- Use the rating to sort and the text to explain. Code the text of one- and two-star reviews with your shared codeframe and you can see which themes drive low ratings, and whether that's changing month to month.
- Read your competitors' customers. You can't easily survey a rival's customer base, but you can read its reviews with the same codeframe you use for your own.
- Treat sources differently. Some review platforms check that reviewers are genuine customers and others don't, and marketplace, B2B and app store reviews are written for very different readers.
- Don't trust the average star rating on its own. Research by Hu, Pavlou and Zhang showed online ratings follow a J-shaped distribution, because people who expect to like a product are more likely to buy it, and people with strong views are more likely to review it. When everyone in their experiment wrote a review, ratings came out roughly normal. Trends and themes are more reliable than the mean.
Review language is also more considered than social posts, so a sentiment model tuned for one can misread the other. We cover that, and how the two sources complement each other, in how to map the full customer voice.
How to prepare your data so the sources can be compared
The analysis usually isn't the problem, more that the three sources were never set up to be compared in the first place.
Clean before you count
Not everything in a social dataset was written by a customer. Researchers writing in MIT Sloan Management Review reported that, across client work in many product categories, just 10% of the posts supplied by a data vendor had been written by an actual consumer. The rest had been written by manufacturers' marketing agencies, e-commerce sellers or bots.
Bots are most key when a topic gets heated. When American Eagle's summer 2025 campaign became a flashpoint, a narrative-intelligence firm told Marketing Brew that nearly 44% of unfavourable posts and around 36% of favourable ones came from accounts likely to be bots. Both sides were being inflated.
So before you code or count anything, filter out brand and retailer accounts, promotional posts, duplicates and likely automated accounts, and record how much you removed.
Duplicates can be a big issue; here's how deduplication works and why it matters.
Use one codeframe across all three sources
If survey open-ends, interview transcripts and social posts are coded with three different sets of themes, you can't compare them. You end up setting "pricing concerns" in one deck against "value for money" in another and "too expensive" in a third.
- Start from qual, where the themes are richest.
- Test the codeframe on a few hundred posts and open-ends. Add what's missing and merge themes nobody can tell apart.
- Keep an "other" code and review it regularly. New themes tend to appear there first.
- Version it, so you always know which codeframe produced which numbers.
Don't leave video out
Short video is now a major source of conversation: 37% of US adults use TikTok, up from 21% in 2021.
In a video, the caption is often the least informative part. Where you can, code transcripts and on-screen text with the same codeframe as everything else, and record the format so you can compare what people say on video with what they write.
Check what your data includes first: our TikTok data coverage guide explains what's available.
Keep the codeframe consistent across markets
Running the same study across countries adds another layer of difficulty. A few habits help:
- Write a short definition and two or three example posts for every code, and translate the definitions, not just the labels.
- Have a native speaker check a coded sample in each language before you compare markets.
- Remember that the platform mix differs from country to country, so compare markets platform by platform rather than as one blended number.
Agree what you're counting
Surveys count people. Qual counts cases. Most social tools count posts. Choose the unit before you compare anything. For social data, that usually means unique authors (see play 4).
Match brands, products and time windows
The same brand turns up under different spellings and nicknames across platforms, and social data moves much faster than reviews, surveys or projects.
We cover both issues in how to map the full customer voice. The short version: resolve names to one entity before you analyse anything, and compare like-for-like time windows.
Get the fields you truly need
Post text alone won't get you far. At a minimum you need:
- An author identifier, so you can count people rather than posts
- Timestamps, so you can line social data up with survey fieldwork and interview dates
- The platform or source, so you can see and correct for skew
- Thread context, so a reply isn't read without the post it answers
- Star ratings, where the source is a review site
If all you get is mention counts and a sentiment score, you're working from a dashboard rather than the data, and most of the methods in this guide won't be possible.
When you're assessing a data source, this checklist for evaluateing a social data API covers what to ask for.
Use AI to code, then check its work
Large language models are the obvious way to code survey open-ends, transcripts and posts with the same codeframe. The evidence on how well they do it is mixed:
- In a 2026 study of 903 open-ended survey answers, agreement between a GPT-5 model and human coders (an Adjusted Rand Index of 0.61) came close to the agreement between the human coders themselves (0.68).
- A 2026 paper in Public Opinion Quarterly found that several of the models it tested scored above 0.8 F1 against human raters when comparing open-ended answers in pairs.
- But when Langer Research tested a leading AI model on a complex poll question, it misclassified responses and struggled to read tone and direction.
- And a study of German open-ended responses found performance differed greatly between models, with only a fine-tuned model reaching satisfactory accuracy.
So have people hand-code a sample from each source, measure how often the model agrees with them, and report that figure alongside your findings. It's the same discipline we recommend for sentiment scores.
Takeaways
- Social data is both qual and quant. Count it and it behaves like a survey. Read it and it behaves like an interview.
- Decide which source leads before you collect anything. Your question sets the order.
- Clean first, then use one codeframe, one unit and matching time windows. Without them, the sources can't be compared.
- Count people, not posts, and check any AI coding against human judgement.
- Finish with a joint display and a clear verdict per theme: confirms, expands or contradicts.
Surveys tell you how many. Interviews tell you why. Social data tells you what people say when nobody's asking, and how that changes over time. Put them together properly and they tell you what to do next.
💡 Combining sources only works if your social data arrives ready to code alongside everything else. Datashake puts structured social and review data behind a single API, so it slots into the codeframe you already use. Get started with Datashake
Glossary
- Codeframe: The list of themes used to categorise open-ended text. One codeframe across all sources is what makes them comparable.
- Convergent design: Collecting different kinds of data at the same time and comparing them at the end.
- Explanatory sequential design: Starting with quantitative data, then using qualitative research to explain it.
- Exploratory sequential design: Starting with qualitative research and using it to build a quantitative study.
- Joint display: A table or chart that shows findings from different sources side by side.
- MRP: Multilevel regression and poststratification: a statistical method for adjusting a skewed sample to represent a known population.
- Quantitizing: Turning qualitative material, such as themes in interviews or posts, into counts.
Frequently asked questions
Is social media data qualitative or quantitative?
Both. Individual posts are qualitative: unstructured text in people's own words. Once thousands of posts are coded by theme, sentiment or topic, the same data becomes quantitative and can be counted and tracked over time.
How do you combine social media data with survey data?
Code survey open-ends and social posts with the same codeframe, match the time periods, and compare the direction and size of change in each. Social data can also help you write the questionnaire, explain why a survey metric moved, and track what happens between waves.
How do you use social listening for market research?
Use social listening to discover what matters before you design research, to explain why a survey metric moved, to measure how common a qualitative finding is, and to keep watch between survey waves. Clean the data first, count unique authors rather than posts, and code it with the same codeframe as your other research.
What's the difference between social listening and surveys?
Surveys ask a defined sample fixed questions, so they measure how many people hold a view. Social listening analyses what people post publicly without being asked, so it shows unprompted opinion at scale and over time, but from a self-selected group. Each covers the other's blind spots.
Can social listening replace focus groups?
No. Social listening shows what people say unprompted and at scale, but you can't ask a follow-up question. It's most useful for deciding what to explore in focus groups and interviews, and for measuring how common their findings are.
What is mixed-methods research in market research?
Mixed-methods research combines quantitative data, such as surveys, with qualitative data, such as interviews, in one study and brings the findings together. Social data fits naturally because it can be analysed both ways.
What is triangulation in market research?
Triangulation means checking a finding against more than one independent source or method. Combining surveys, qual and social data is a strong form of it, because each source is biased in a different way.
What is netnography?
Netnography is a qualitative research method, developed by Robert Kozinets, that adapts ethnography to online communities. Researchers study conversations on social platforms and forums to understand the culture and meaning behind consumer behaviour.
How closely does social data match survey results?
Related, but not interchangeable. A 2021 Journal of Marketing study found a Twitter-based brand reputation measure correlated with survey measures of word of mouth, buzz and purchase intention at roughly 0.25 to 0.36. That's useful as an early signal, not a replacement for the survey.
Can you weight social media data like a survey?
Sometimes. Methods such as multilevel regression and poststratification can correct heavily skewed samples when you know who is in them, using survey or census benchmarks. Most social data lacks reliable demographics, so simpler approaches, like weighting or reporting by platform, are more common.
What are the limitations of social listening for market research?
Social data only covers people who choose to post publicly, skews by platform, over-represents a vocal minority, includes brand, spam and bot content, and can't answer follow-up questions. That's why it works best alongside surveys and qualitative research, not instead of them.
.png)



More insights you might like