Social and Review Data for Consumer Insight: The Researcher’s Guide to Unstructured Data
Have you been powering your consumer insights with surveys?
Then you've probably run into their Achilles' heel: a survey can only answer the questions you asked.
You pick the questions, you write the answer options, you decide who to ask. What comes back is determined by those three decisions, so anything customers care about that you didn't anticipate never appears. And even the answers you do get are polished, because people tend to report the version of themselves that sounds best.
That's why surveys need a second opinion. And fewer people are picking up the phone to answer at all.
The good news is that there’s an alternative: using social and review data for consumer insight. Where customers set the agenda; talk about what matters to them, compare you with whoever they like, and describe your product in language your brand team would probably never sign off.
And because it moves in close to real time, a problem can surface there before you can even send off your next survey.
This all sounds too valuable not to collect, right?
The challenge is that none of it is collected for you. There's no sample, and no questionnaire. To turn it into consumer insights you can stand behind, you have to build the research design in yourself.
In this guide, find out the seven steps to collecting social and review data for consumer insight and the questions you'll need to answer along the way. ⬇️
What you’ll learn
- Why social data counts as “unstructured” for a researcher, and what that means in practice
- Where social listening fits next to surveys, qual and behavioural data
- A seven-step method: question, sampling frame, query, cleaning, coding, analysis and reporting
- Which analysis method suits which research question
- How to use AI to code posts without misleading yourself, and whether ChatGPT can do social listening
- How to quote public posts ethically
- A checklist for the method note in your next report
Quick answer
Social listening becomes consumer research when you run it as a study rather than a feed. Start from a research question. Say who your data represents. Measure how well your search query works. Remove duplicates, brand posts and synthetic content. Code the posts against a tested codebook. Count people rather than posts. Then write a short method note explaining what the data can and can’t tell you.
What is social listening for consumer insight?
Social listening for consumer insight is the use of public social and review content as research data.
The data is collected against a defined question, filtered and coded in a consistent way, and interpreted with its biases stated. That’s why it’s different from brand monitoring, which tracks mentions so a team can reply to them.
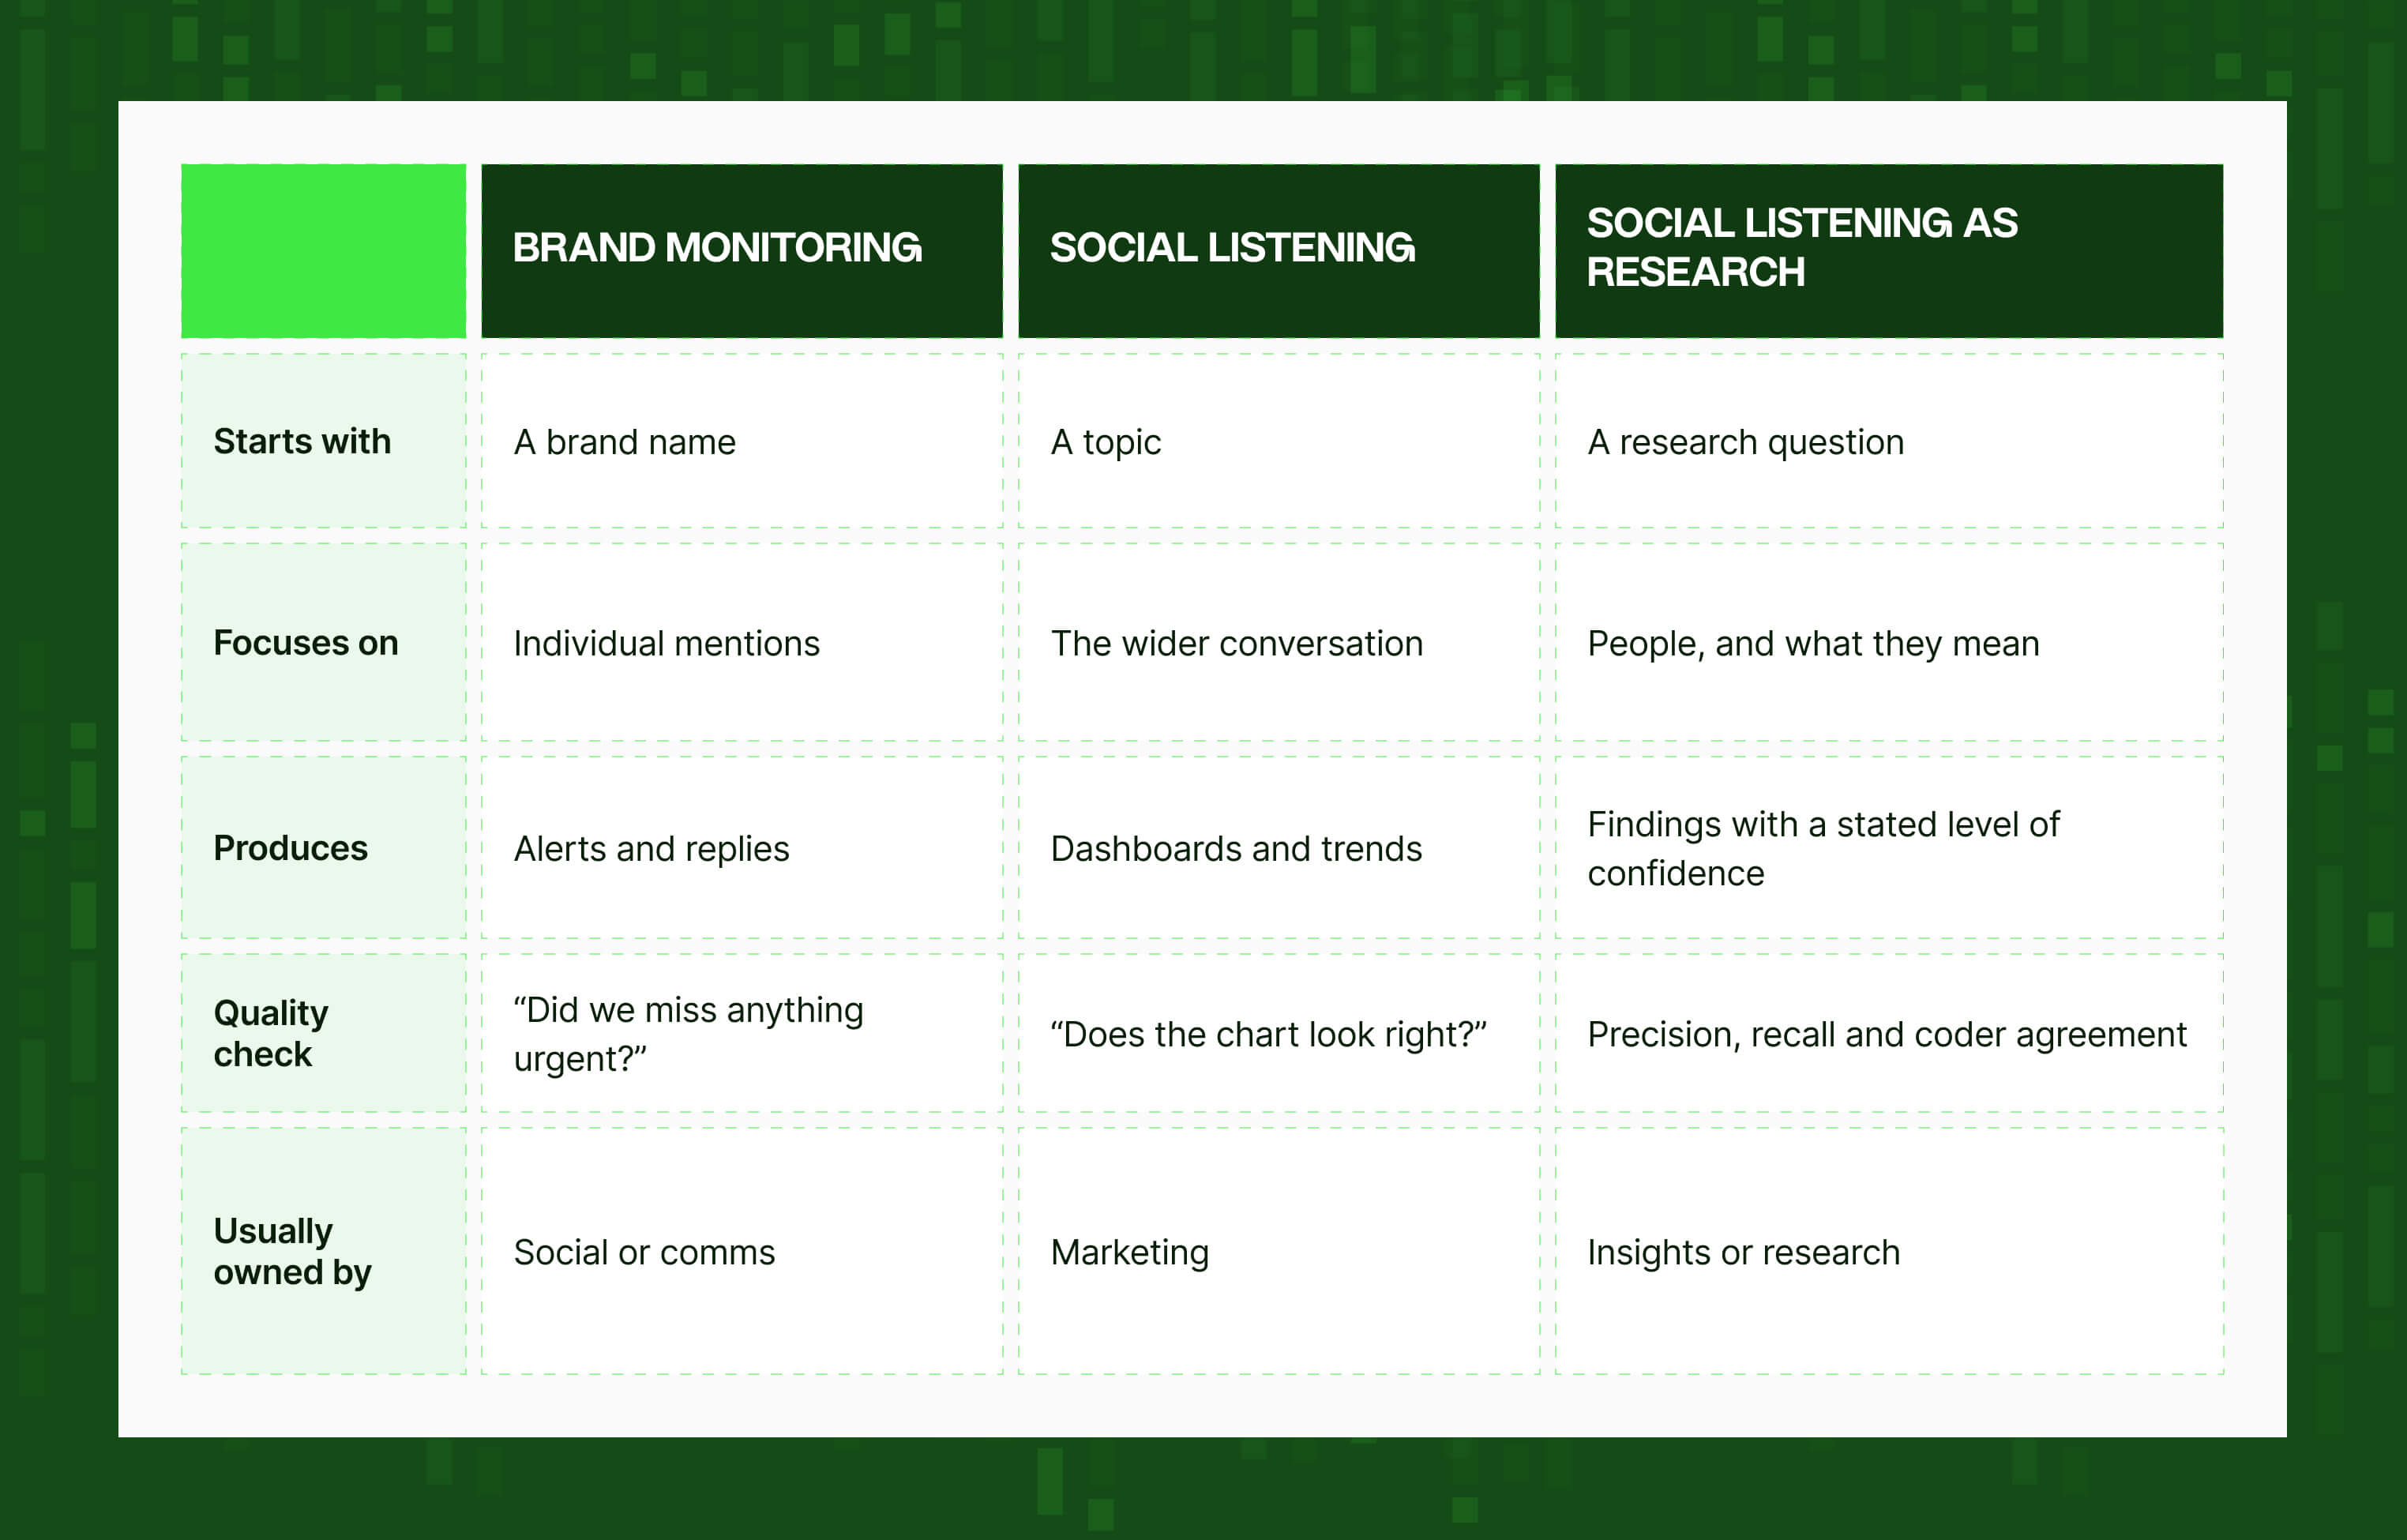
If you’re looking for monitoring software, we’ve compared 24 brand monitoring tools separately.
Why is social data “unstructured”?
Ask a data engineer and they’ll tell you unstructured data is anything that doesn’t fit neatly into rows and columns: text, images, audio, video.
But there’s a more useful definition of this for a researcher: social data arrives without the research design that normally makes data trustworthy.
Designed data vs found data
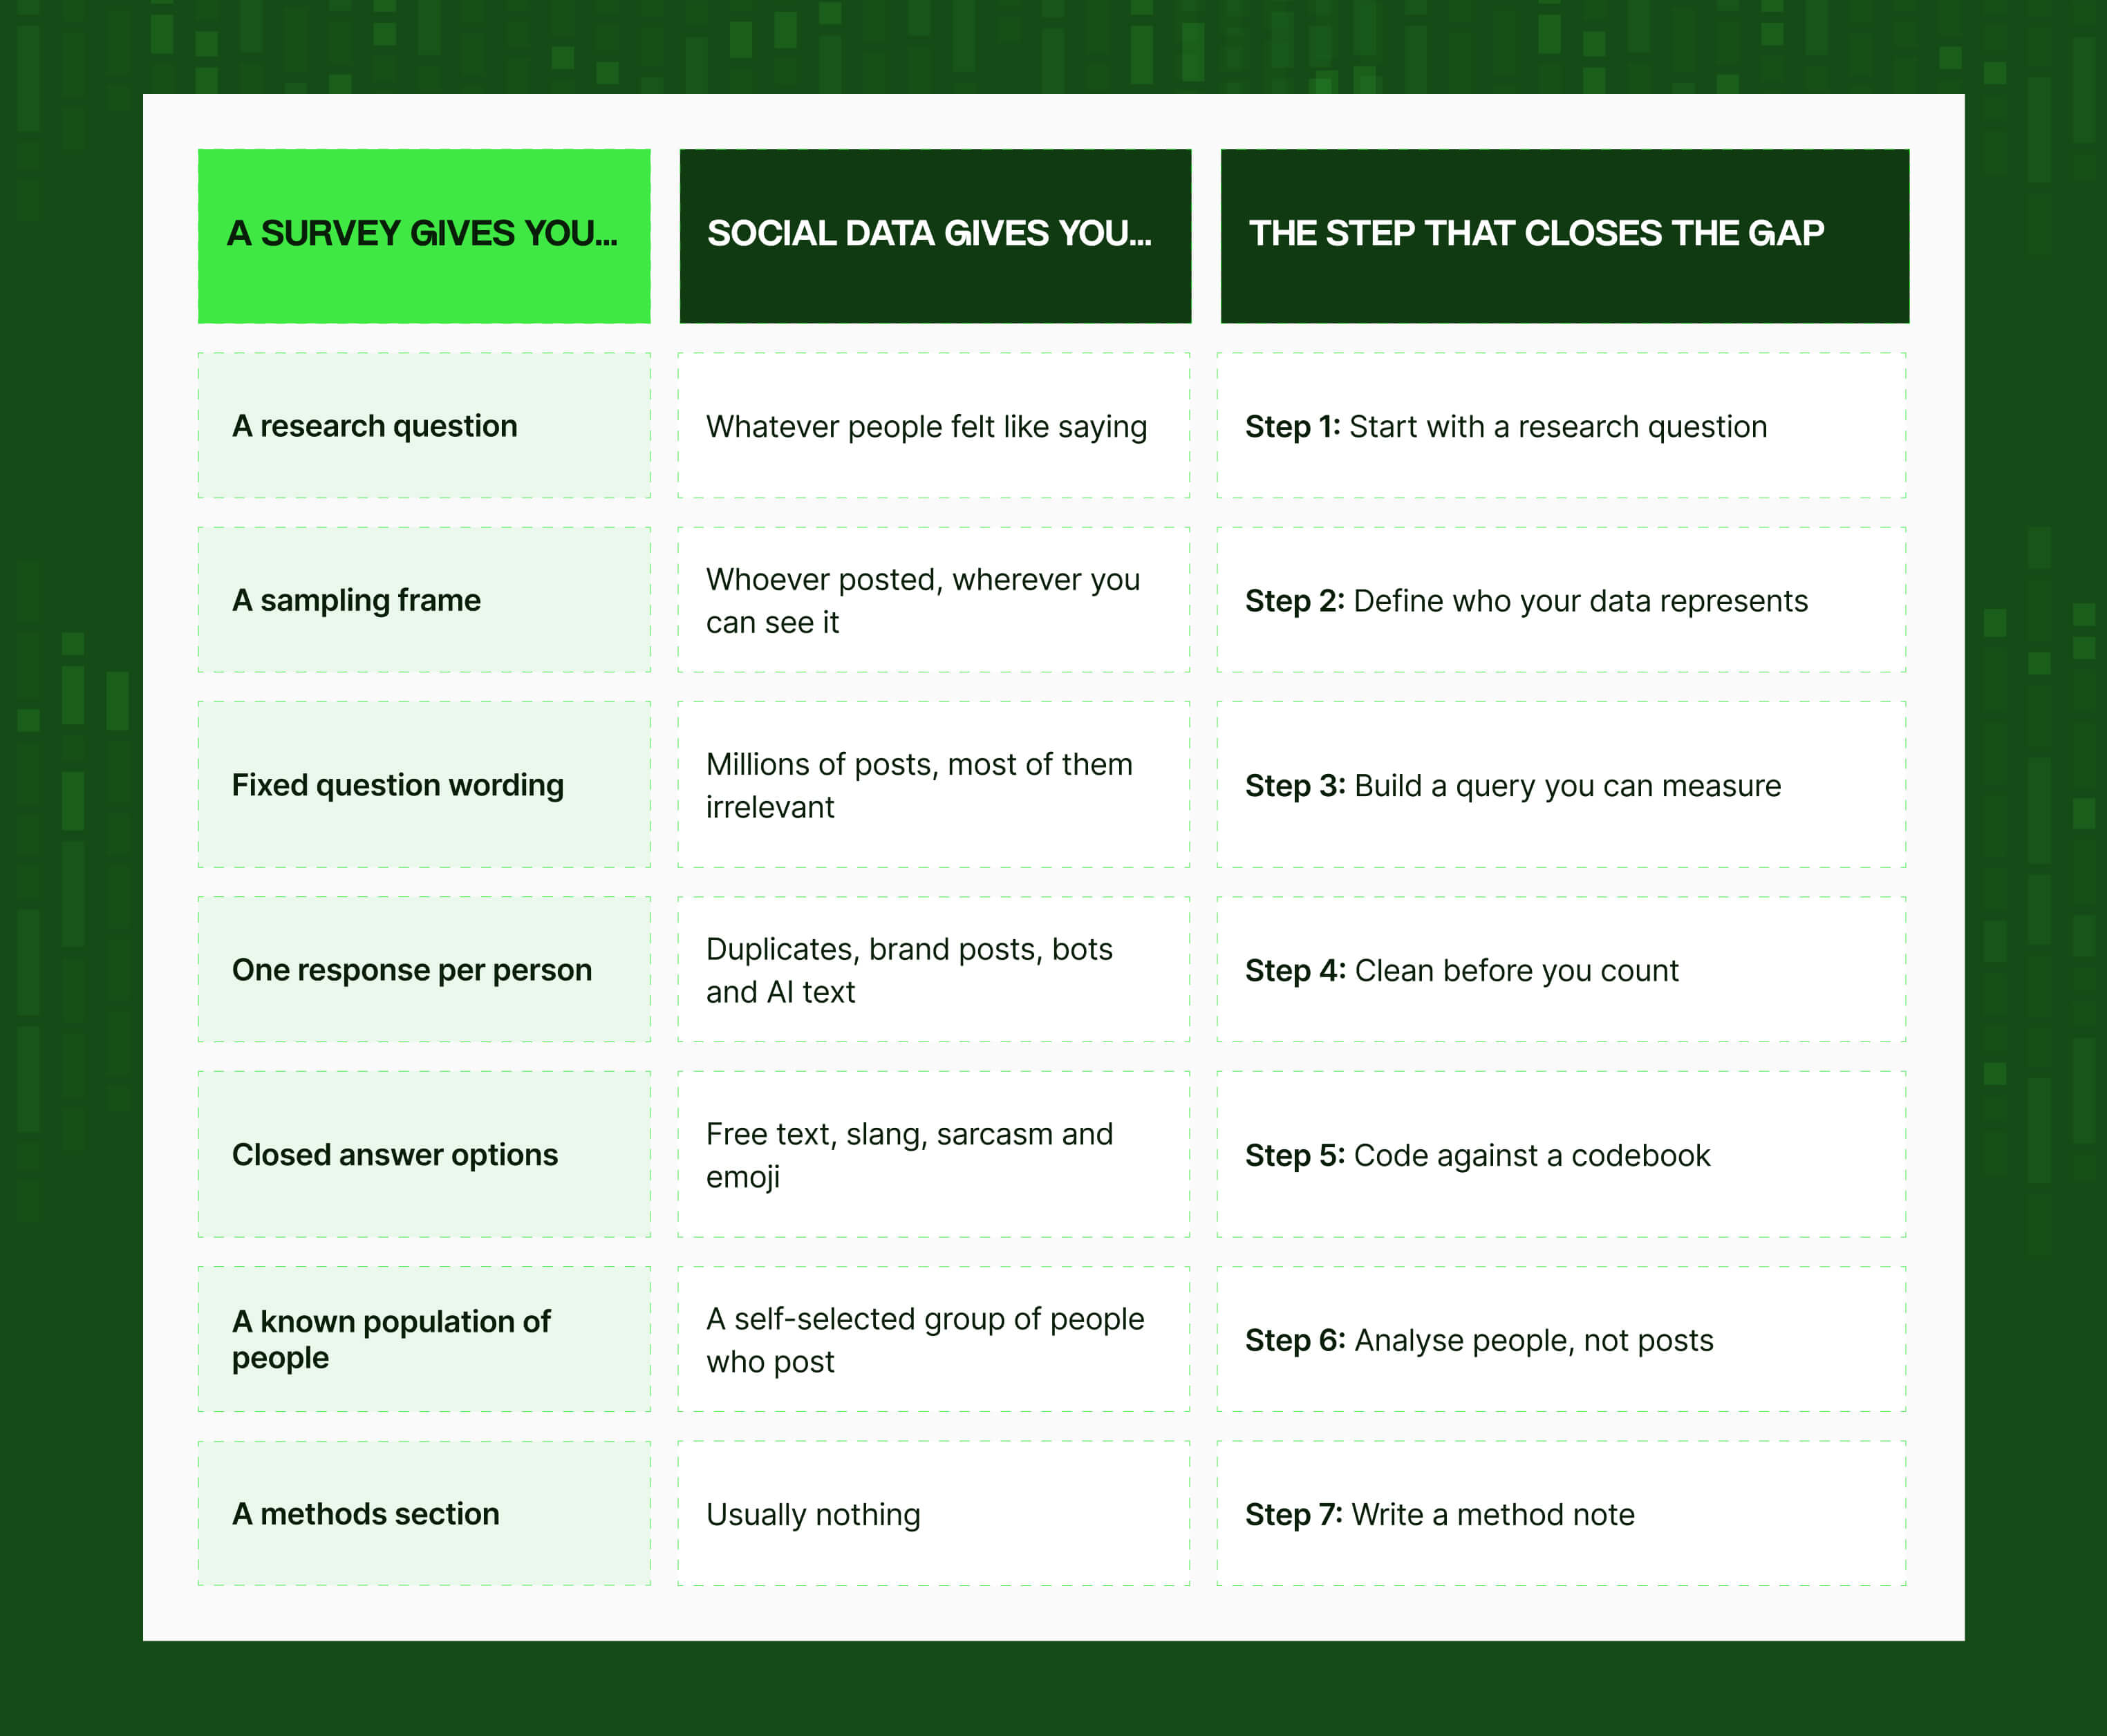
A survey is designed data. The sample, the questions, the answer options and the target population were all decided before a single response came in.
Social data is found data. It was created for other reasons, by people who chose to post, on platforms that each have their own rules and audiences. If you want to use it for research, you have to add the design afterwards.
Each piece that’s missing lines up with one step of the method:
More and more of it isn’t text
A growing share of consumer conversation happens in short video, where the useful part is what people say and show on screen rather than the caption underneath.
So if your dataset only holds captions and hashtags, you’re missing most of what was said.
💡 Our post on why social media data is incomplete goes through the most common ways gaps get into a dataset.
Where does social listening fit in consumer research?
Social listening has strong academic roots.
In 2002, marketing professor Robert Kozinets published a method he called netnography: ethnography adapted to online communities. Writing in the Journal of Marketing Research, he described it as faster, simpler and cheaper than traditional ethnography, and “more naturalistic and unobtrusive than focus groups or interviews.”
It’s now a staple in the insights toolkit. According to Greenbook’s GRIT 2026 Insights Practice Report:
- 63% of brand-side researchers use social media and online content research, and 68% use text analytics
- Among brand-side analytics professionals, those figures are 86% and 77%
There is a interesting split in the report. Researchers are much more likely than analysts to lead consumer market insights (62% vs 36%), yet analysts use more social data. So the people who own the consumer question often aren’t the people building the dataset. Food for thought on stripping down those silos for more powerful consumer insight.
What social listening is good at, and what it isn’t
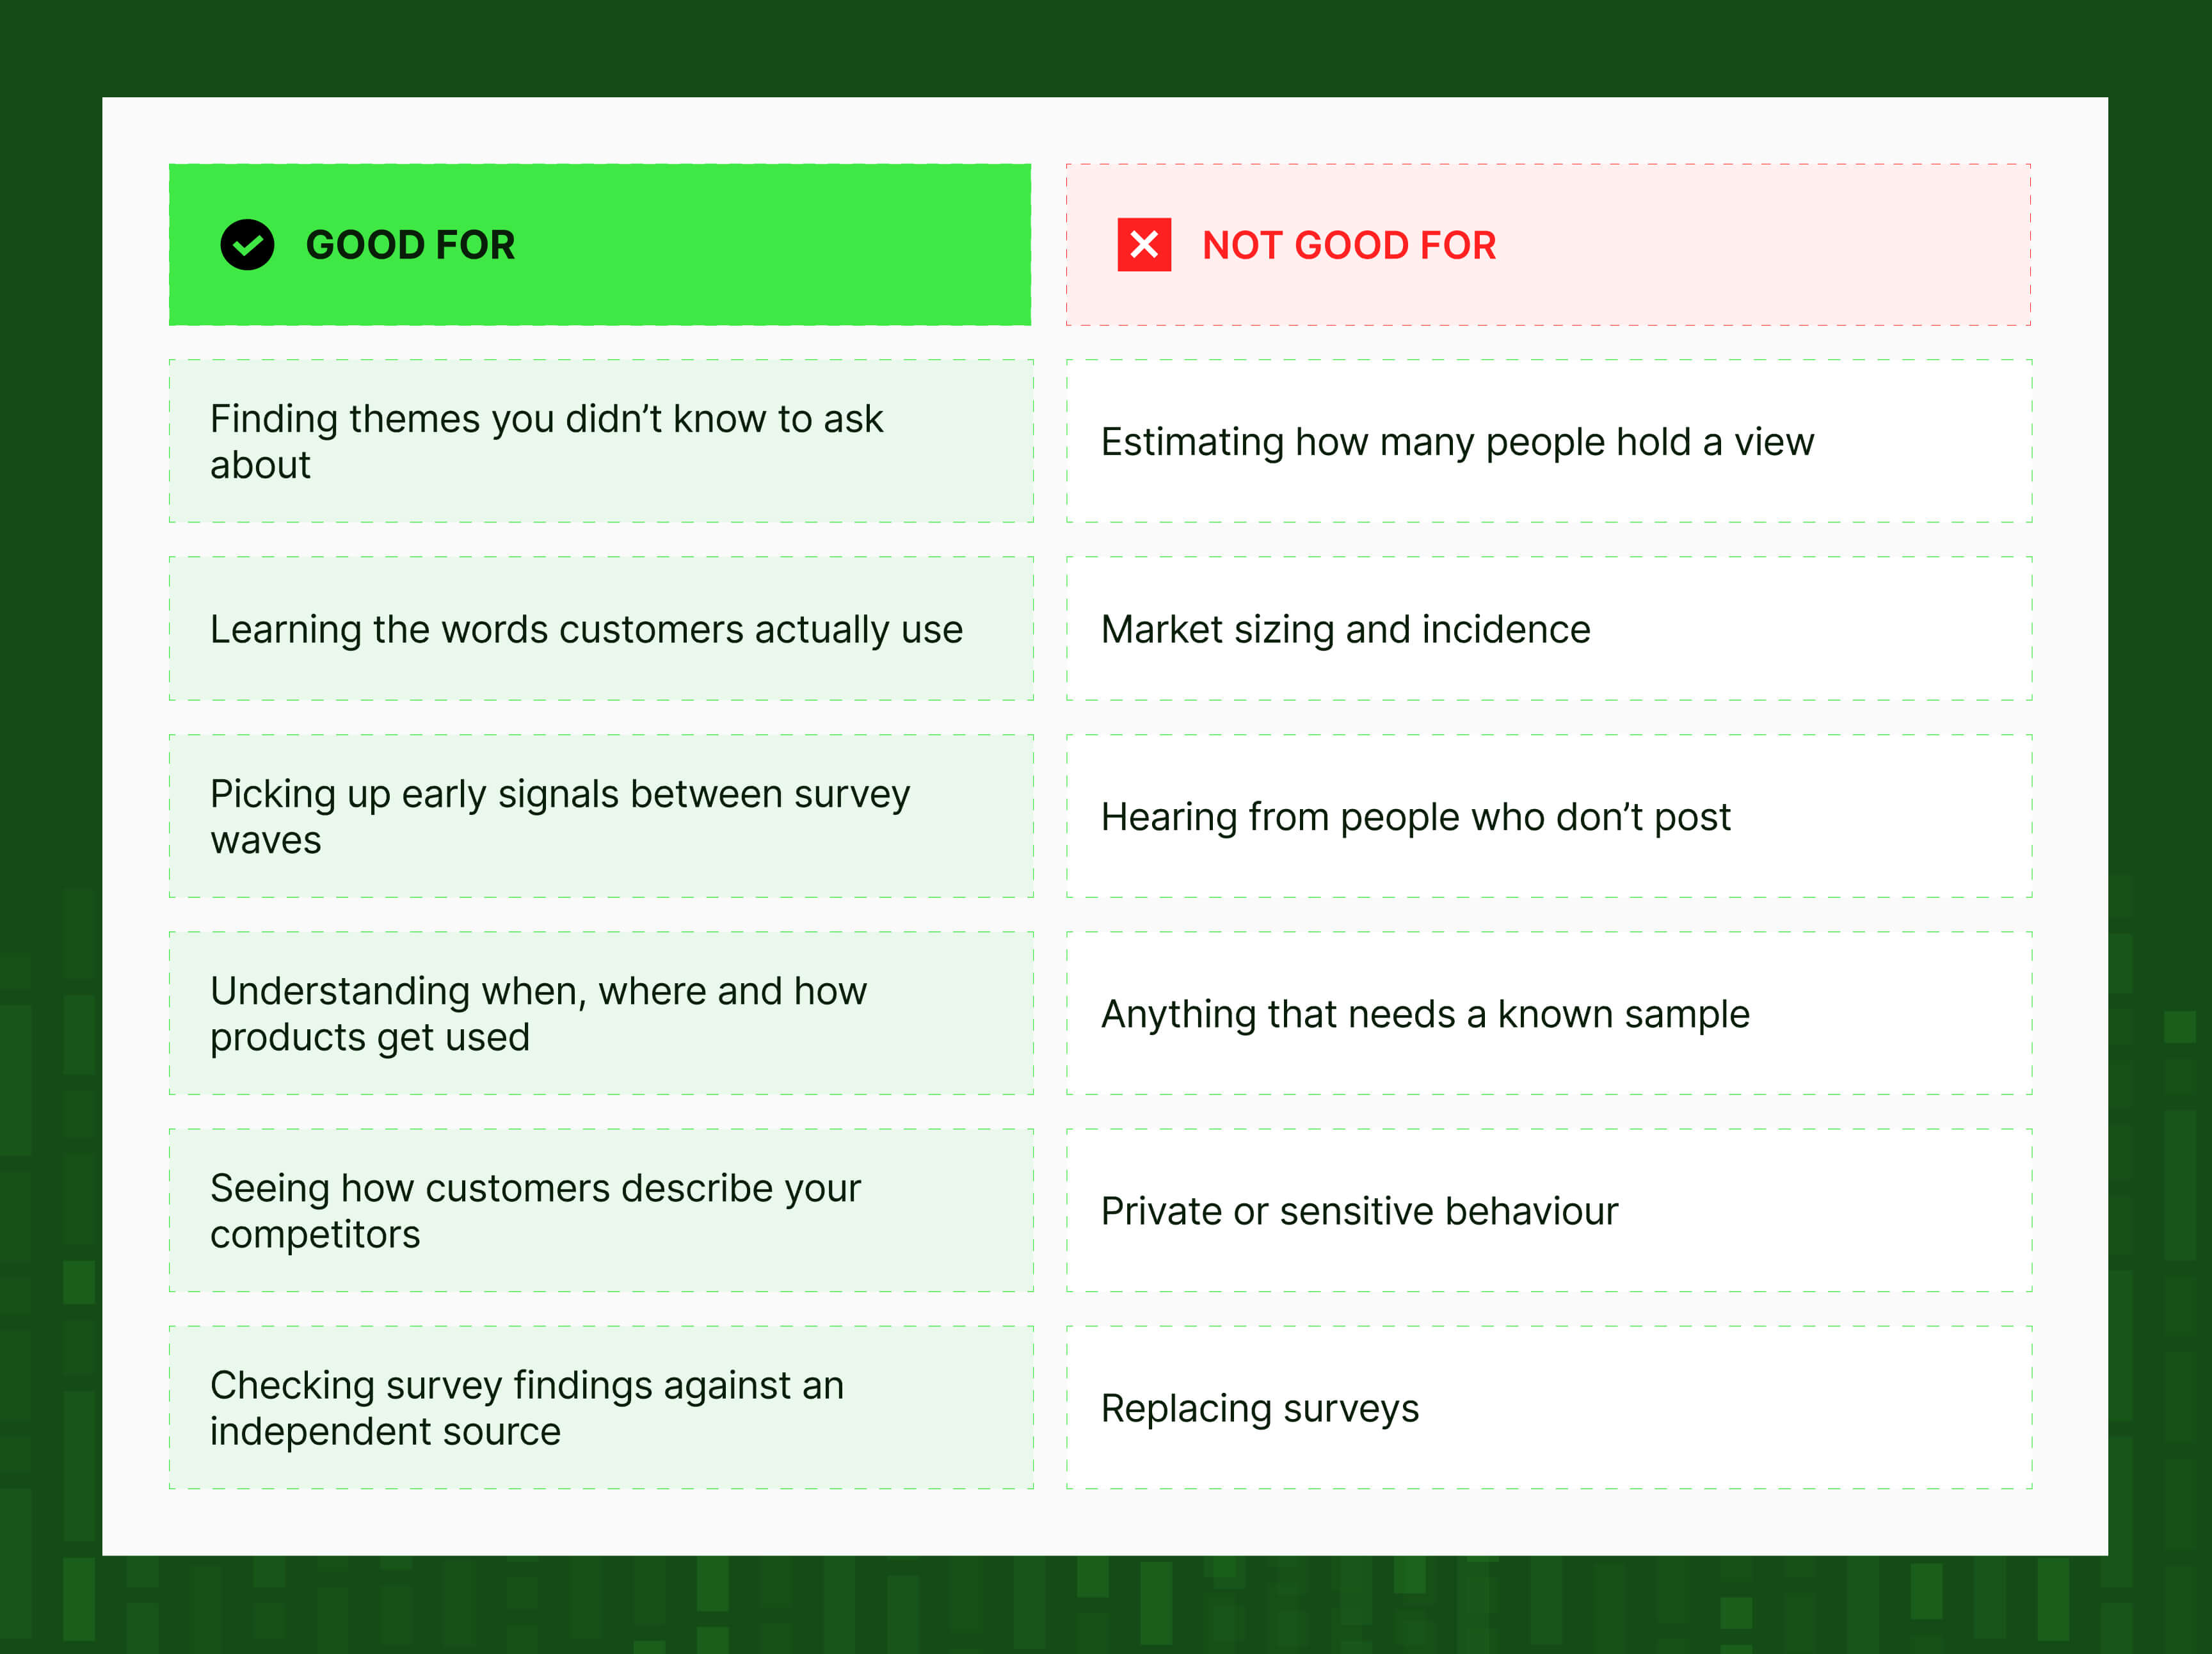
Roughly speaking, social data is strong on what and how questions and weak on how many.
That’s why it works best next to a survey. The two can go wrong in different ways, so when they agree you can trust the finding more.
➡️ For a wider view of where social data earns its keep, see the most impactful use cases for social data in 2026.
How do you use social listening for consumer research? The 7-step method
Here’s the method in brief:
- Start with a research question, not a keyword list
- Define your sampling frame and be honest about who it represents
- Build a query you can measure, using precision and recall
- Clean the data before you count anything
- Code posts against a codebook, with people, AI or both
- Analyse people rather than posts, against a baseline
- Write a method note that states what the data can’t show
[Image: horizontal seven-step pipeline, Question → Frame → Query → Clean → Code → Analyse → Report, each step labelled with the question it answers. Alt text: “The seven-step social listening research method, from research question to method note”.]
To keep things concrete, we’ll follow one made-up project all the way through:
Example brief (hypothetical): You’re the insights lead at a UK pet-food brand. Repeat purchase of your dry cat food dropped after a recipe change in the spring. Leadership wants to know why before the next quarterly tracker comes in.
Step 1: Start with a research question, not a keyword list
The research question drives every later decision: which sources you need, which dates to pull, what counts as relevant, what goes in your codebook, and what you treat as not worth paying attention to.
A lot of listening projects begin the other way round. Someone types the brand name into a tool and waits for an insight to turn up.
❌ “Track mentions of our brand.”
✅ “What reasons do UK cat owners give, in their own words, for switching away from our dry food since the recipe change?”
That second version tells you straight away:
- Who you’re interested in: UK cat owners, not vets, retailers or your own social team
- What to look for: reasons for switching, so posts about stopping, swapping or refusing the food
- When: since the recipe change, which means you’ll also need data from before it as a comparison
- How to code it: by reason, not just by positive or negative
A quick test: if you can’t write the finding you’re hoping to report as a single sentence before you start, the question needs more work.
💡 Write your hypotheses down before you look at any data. It stops you adjusting them once the charts arrive.
Step 2: Define who your social data represents
Every social dataset has a sampling frame, whether or not anyone wrote it down.
It’s the set of sources you included, the content types you collected, the languages you kept and the dates you covered. Write yours as one sentence:
“Public English-language posts, comments and product reviews from UK-accessible sources, March to September 2026, mentioning our brand, three competitors, or ‘cat food’ alongside switching language.”
Now you know what you’re generalising from. The harder part is being honest about who you can generalise to. Four things tend to get in the way ⬇️
1. A few people do most of the posting
When Pew Research Center studied a representative sample of US adults on X (then Twitter), it found that the most active 10% of users produced 80% of all tweets. The typical user posted twice a month, and the typical user in that top 10% posted 138 times a month.
This isn’t unique to one platform. Back in 2006, usability researcher Jakob Nielsen described participation inequality in online communities as the 90-9-1 rule: about 90% of people only read, 9% contribute now and then, and 1% produce most of the content.
So if you count posts, you’re mainly measuring that 1%.
2. Some people won’t talk at all
Silence isn’t random either. In a 2014 Pew study of 1,801 US adults, 86% were willing to discuss a contested news story in person, but only 42% of Facebook and Twitter users were willing to post about it. And the people who wouldn’t discuss it face to face almost never turned to social media instead.
That means sensitive or unfashionable opinions are under-represented in public conversation for consumer research. The cat owner who moved to a cheaper own-brand food to save money might never mention it online.
3. Every platform has its own crowd
Different platforms lean towards different ages, genders, incomes and interests. A dataset that relies heavily on one source picks up that source’s audience.
We’ve written a five-step audit for this: is your social data representative?
The short version: if one source makes up more than half of your data, your findings mostly describe that source’s users.
It’s also worth knowing where your category’s conversation actually happens. Our comparison of where communities talk on TikTok vs Reddit shows how different the same topic can look from one platform to the next. For platform-specific gaps, see our guides to TikTok data coverage and what you can and can’t access from Facebook.
4. Reviews have their own bias
Review data feels more solid than social posts. It’s written by buyers, about a specific product, usually with a star rating. But reviews come with two strong biases of their own (Hu, Pavlou & Zhang, MIS Quarterly, 2017):
- Acquisition bias: people who expect to like a product are the ones who buy it, so they’re also the ones who review it.
- Under-reporting bias: people who were delighted or furious are more likely to write a review than people who thought it was fine.
Together, these produce the familiar J-shaped distribution: plenty of five-star reviews, a smaller cluster of one-stars and not much in between. A study of more than 280 million reviews across 25 platforms found the pattern is widespread and makes average ratings less informative (Schoenmueller, Netzer & Stahl, Journal of Marketing Research, 2020).
So the untroubled, neutral middle is under-represented, and the review text tells you far more than the star average. The same applies to app reviews; our guide to app store review data covers what you can collect there.
Access to public data keeps changing
On top of all that, the routes into public data keep narrowing:
- Meta shut down CrowdTangle, its public-content research tool, on 14 August 2024. Its replacement is limited to researchers at qualified academic and non-profit institutions.
- The EU’s Digital Services Act created a formal route for researchers to request platform data, and the application portal opened in October 2025. But vetted researchers must be independent from commercial interests and must be studying systemic risks. A brand’s insights team won’t qualify.
The takeaway is simple: know exactly where your data comes from and what that route leaves out.
Can you correct for the bias?
To a degree. The best-known example comes from election forecasting.
In 2012, researchers ran a poll through the Xbox games console and collected answers from 345,858 people. The sample was 93% male, compared with 47% of the electorate, and 65% aged 18 to 29, compared with 19%.
After statistical adjustment using a technique called multilevel regression and poststratification, their forecasts came out close to the actual result and in line with the leading poll aggregators (Wang, Rothschild, Goel & Gelman, International Journal of Forecasting).
The issue is that the adjustment needs demographic information for every respondent. Xbox users answered questions about their age and gender, but most social posts don’t come with rock hard demographics.
So for most consumer projects, the sensible approach is to describe the sample, reduce the biggest skews and scope your claims to match.
❌ “Cat owners are unhappy with the new recipe.”
✅ “Among cat owners posting publicly about the recipe change, the most common complaint was…”
Step 3: Set up a query you can measure
Your search query plays the role of your questionnaire: it decides what gets into the study. However, the difference is that, unlike a questionnaire, nobody usually reviews it.
Precision and recall, explained
Two numbers tell you whether a query is doing its job. They come from information retrieval, and health researchers have used them to assess social data since at least 2016.
- Precision is the share of posts you collected that are actually relevant.
- Recall is the share of all the relevant posts out there that you managed to collect.
[Image: two overlapping circles, “What your query collected” and “What’s actually out there”. Precision = overlap ÷ collected. Recall = overlap ÷ out there. Alt text: “Precision and recall for social listening queries”.]
High precision with low can signal means your data is clean but you’ve missed a lot of the conversation. Whereas high recall with low precision means you caught everything, plus plenty of irrelevant posts.
How to measure precision
- Take a random sample of the posts your query returned.
- Have someone mark each one as relevant or not relevant to your research question.
- Divide the number of relevant posts by the number you checked.
How many posts should you check?
That depends on how exact you need the figure to be. These are the standard sample sizes for estimating a percentage at 95% confidence:
These are worst-case figures. If your precision is very high or very low, the estimate will be a little tighter.
In practice, around 100 posts is enough to tell a good query from a bad one while you’re refining it, and around 400 is enough for a figure you’re happy to report.
How to measure recall
Measuring recall is harder, because you’re trying to measure what you didn’t collect.
- Build a small benchmark set of relevant posts a different way: a much broader search, or reading the relevant communities by hand.
- Check how many of those posts your main query also picked up.
- Divide the number it caught by the number in the benchmark set.
How to improve your query
Start with a few seed terms, then read what comes back. Customers rarely refer to your product the way your brand guidelines do.
❌ "Brand X" AND ("recipe" OR "formula")
✅ ("Brand X" OR "brandx" OR common misspellings OR product nickname) AND (recipe OR formula OR "new version" OR changed OR "won't eat" OR "stopped eating" OR switched OR swapped) NOT (giveaway OR competition OR "#ad")
Then go round again. Measure, read the false positives, add exclusions, read what you missed, and add the words people actually use. You’ll find that the majority of queries need several rounds before they’re ready.
💡 Include both numbers in your method note. If someone hands you a social dataset and can’t tell you either one, you have no way of knowing what’s been left out.
Step 4: Clean the data before you count anything
In a survey, each respondent is one row. In social data, one person can show up dozens of times, and plenty of rows don’t come from people at all.
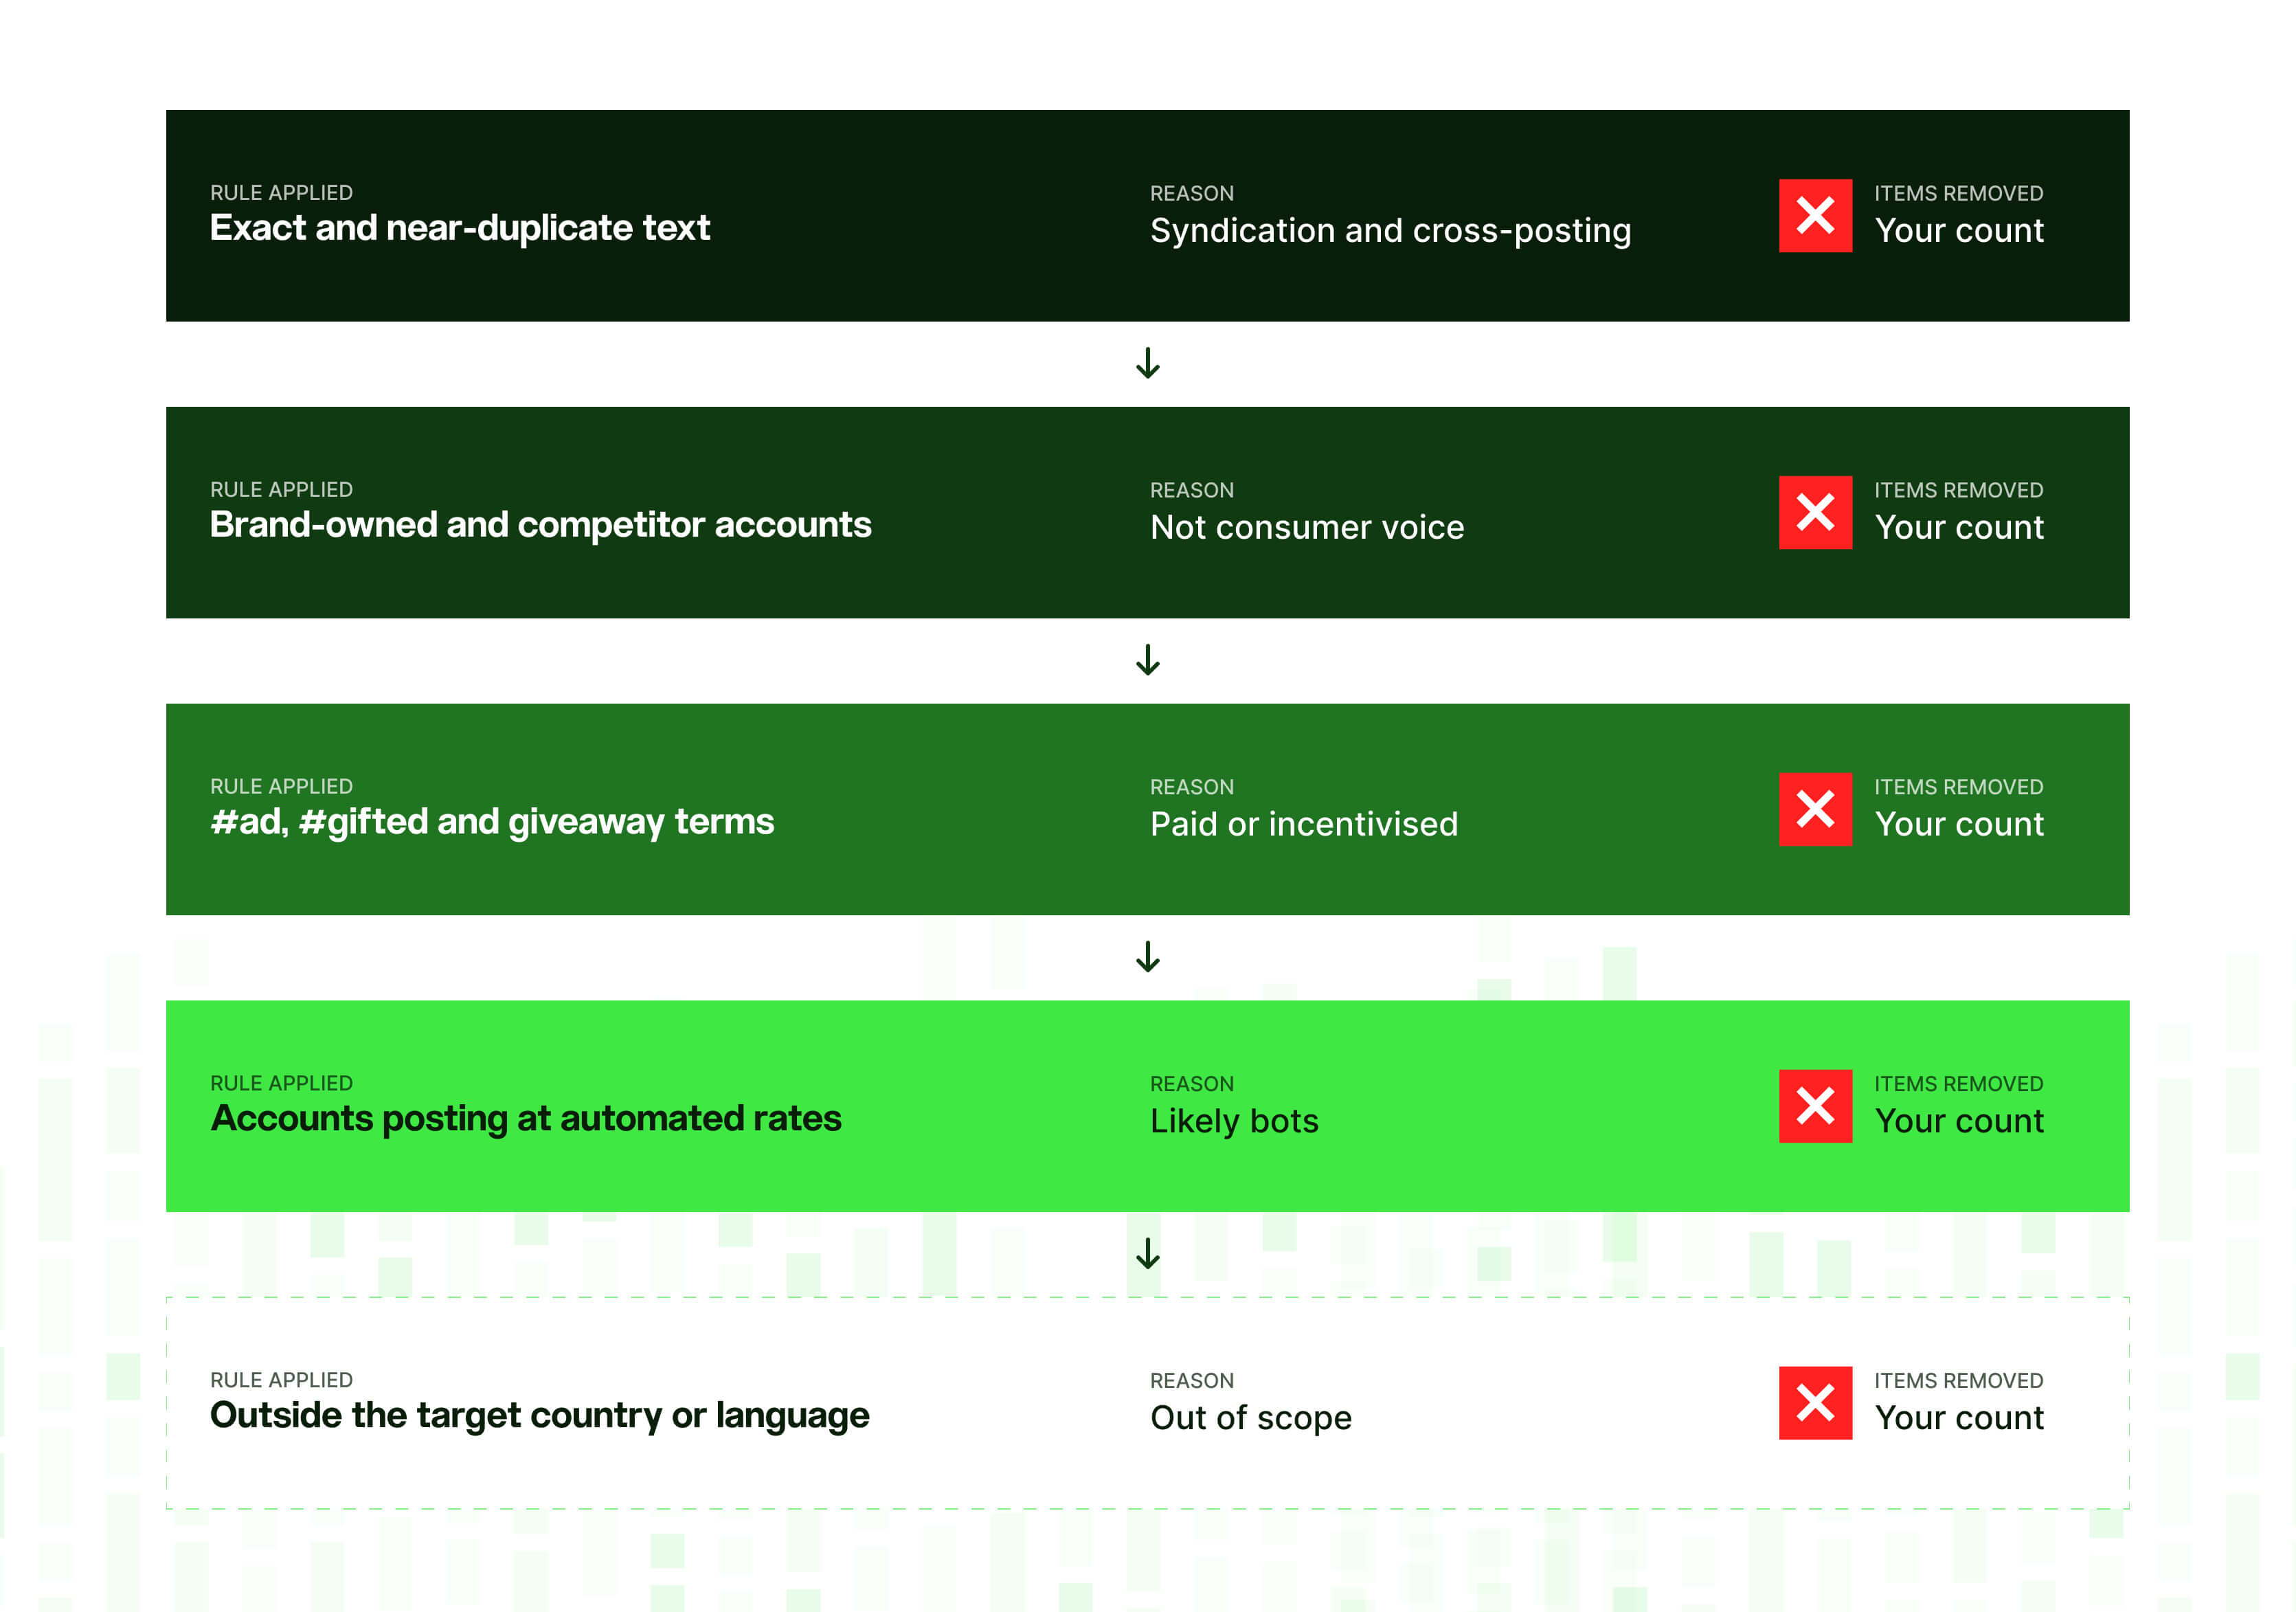
Remove the following before you calculate anything ⬇️
Duplicates and near-duplicates
Reposts, syndicated content and the same review copied across several retailer sites. If you leave them in, whatever they say gets counted several times.
Our guide to social data deduplication explains how it works and what goes wrong when it’s done badly.
Brand, paid and affiliate content
Your own posts, your competitors’ posts, influencer ads and affiliate reviews. They tell you about marketing, not about what consumers think.
Bots and coordinated accounts
Automated activity is widespread online.
Imperva’s 2025 Bad Bot Report found that automated traffic overtook human traffic in 2024, making up 51% of all web traffic. However that figure does cover web traffic in general, not social posts specifically.
Even so, it’s a good reminder that an account posting something doesn’t automatically mean a human having an opinion.
So look out for these signs: accounts that post at impossible rates, identical text appearing across several accounts, and bursts of activity with no real-world event behind them.
AI-generated text
Synthetic reviews and posts are growing. Originality.ai estimated that about 19% of the Google reviews it sampled in 2024 were likely AI-written, up from about 12% in 2023.
Anything out of scope
That would be in the wrong language, wrong country, wrong product, and spam.
Going back to our cat-food project, that could mean removing your brand’s own replies, a batch of giveaway posts, pet-shop listings copied across marketplaces and a cluster of near-identical five-star reviews from brand-new accounts.
Keep a cleaning log
Write down what you removed, why you removed it and how many items went. It takes a few minutes, and it answers anyone wondering why you left things out.
💡 If cleaning takes up more of your team’s time than analysis, that’s a sign of a pipeline problem rather than a research problem. See six fixes for your social media data pipeline and why data collection complexity costs more than it looks.
Step 5: Code posts against a codebook, with people, AI or both
Coding is where free text turns into something countable. Each post is tagged against categories such as reason for switching, product feature or emotion.
For decades that work was done by human coders. Now it’s increasingly done by large language models (LLMs). The evidence on how well that works is mixed though.
Which analysis method fits which research question?
Coding isn’t a single technique. Choose the method that fits what you need to find out:
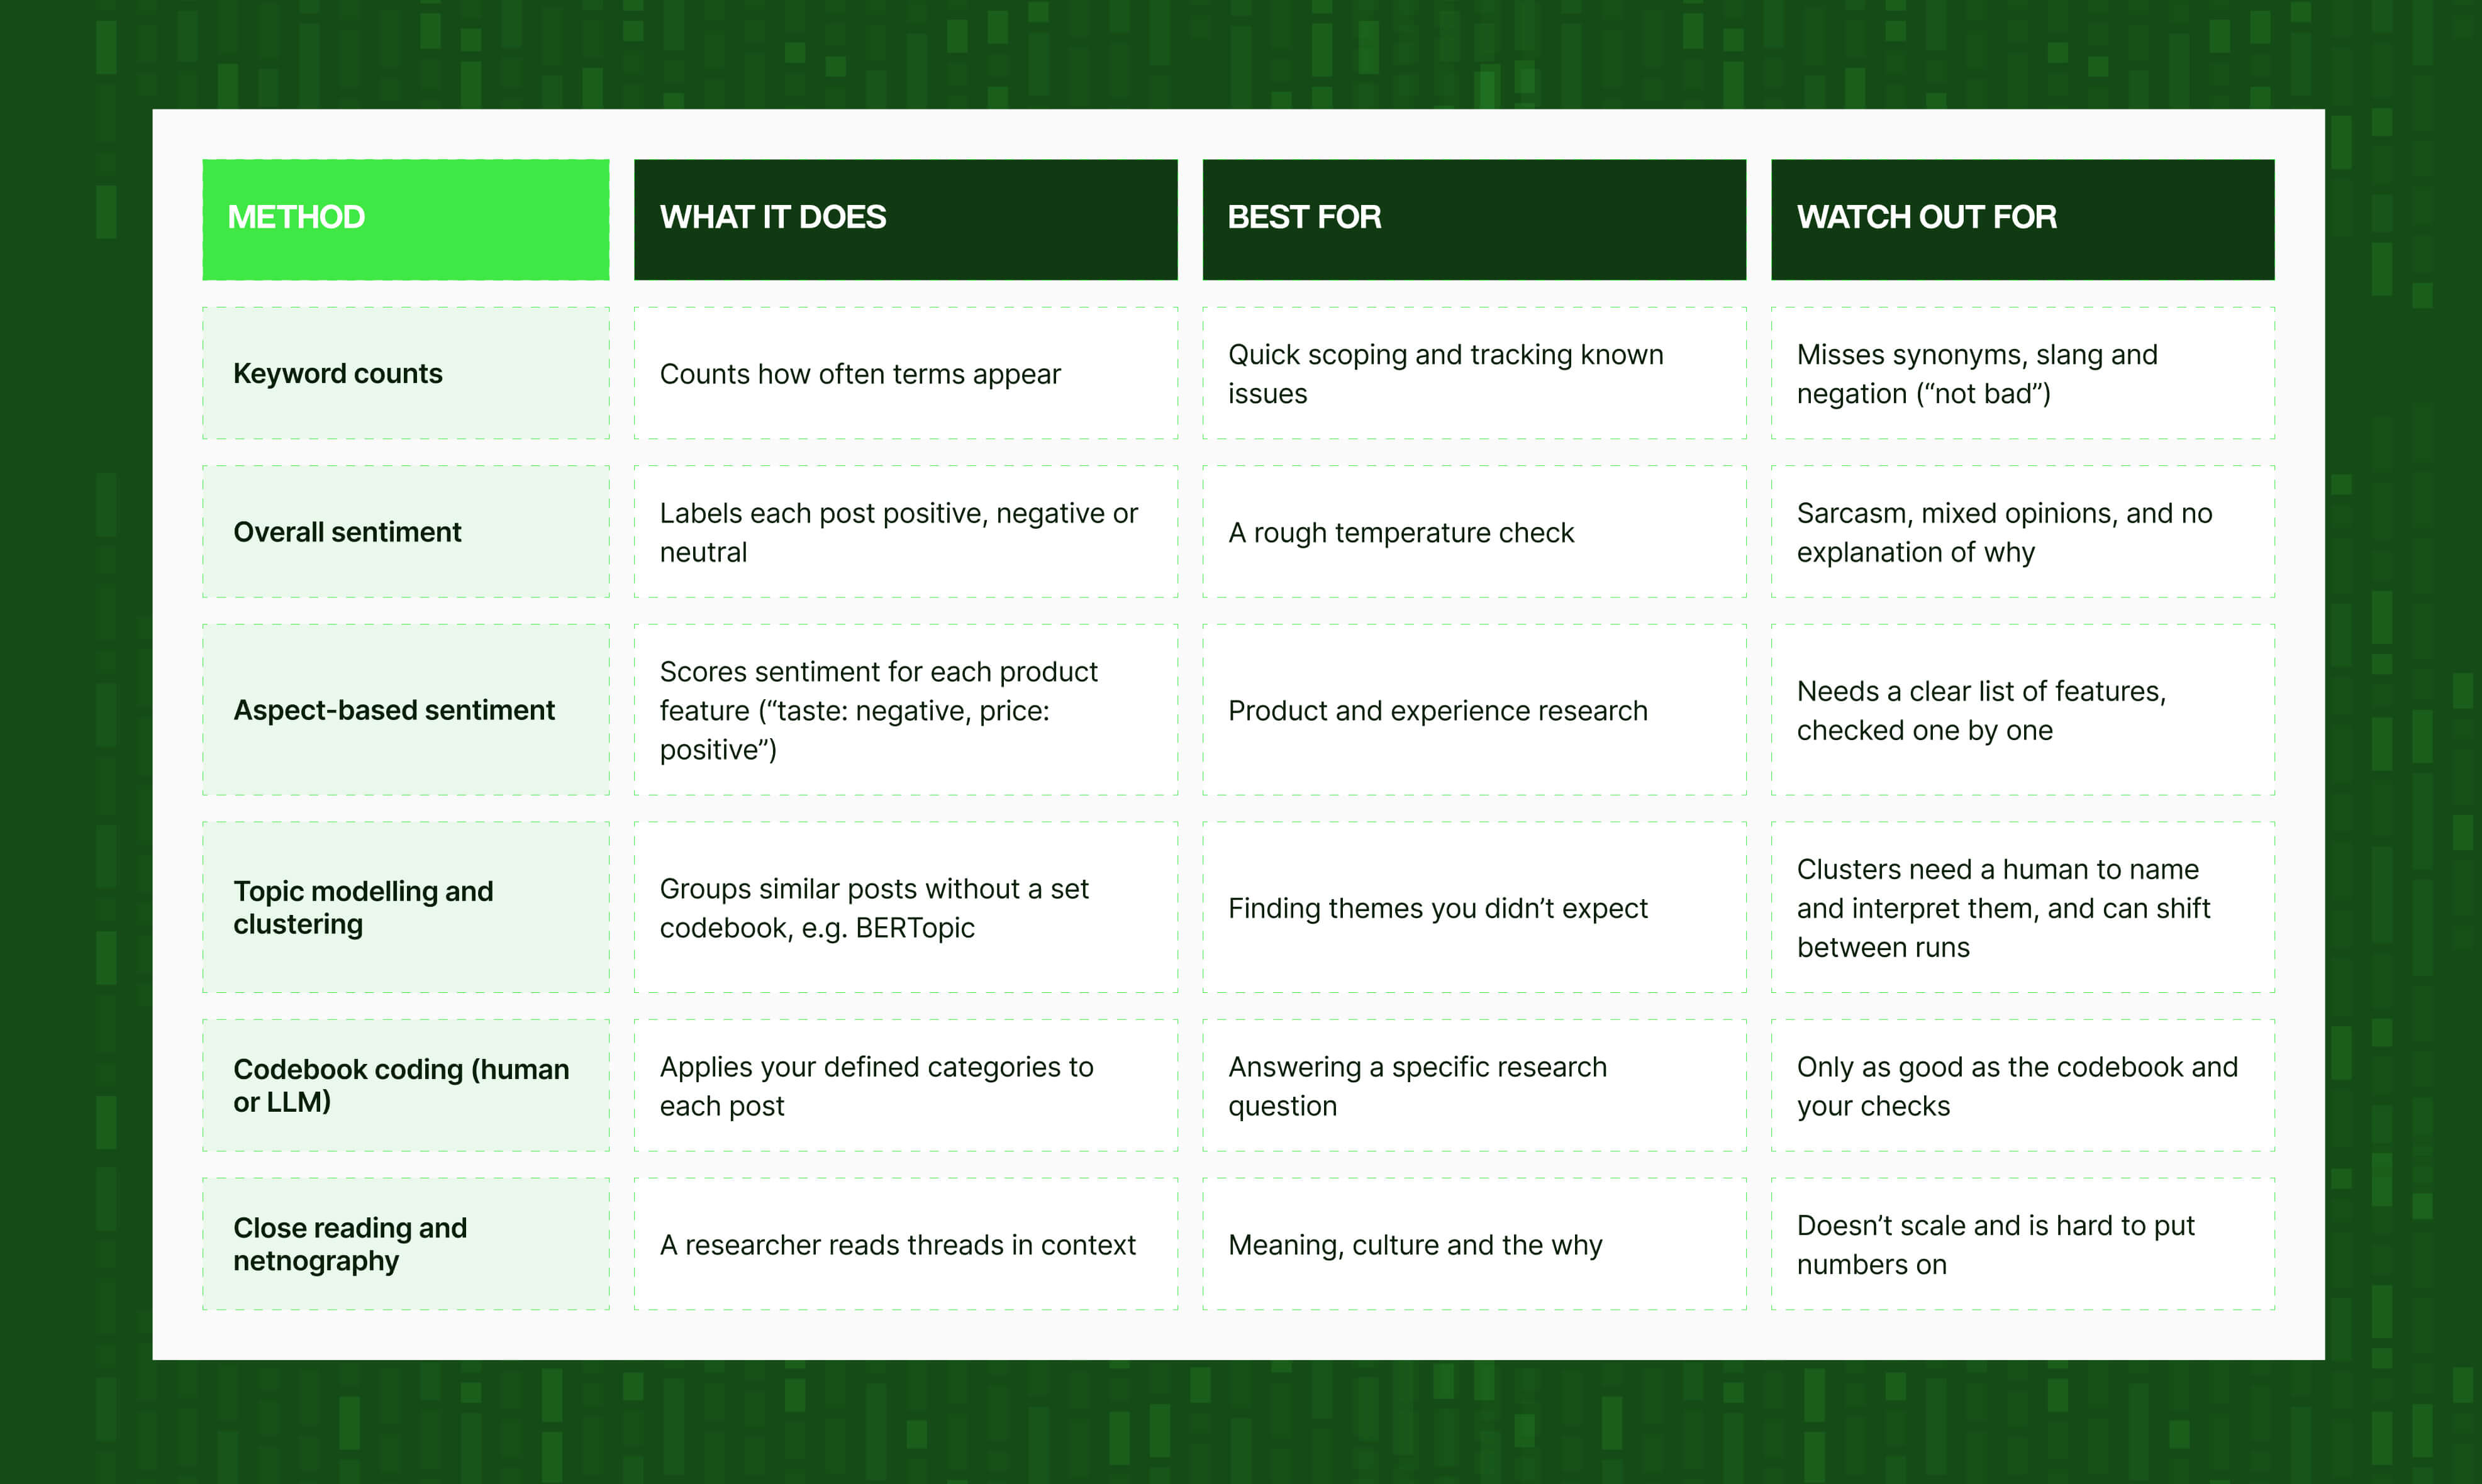
The strongest projects combine several. Use clustering to find the themes, turn those themes into a codebook, code at scale, then read closely wherever the numbers look odd.
Video and audio: if the conversation happens on video, transcribe it first and code the transcript. Captions and hashtags leave out most of what’s said.
Other languages: if your data covers more than one language, test your coding separately for each. A model that handles English well can still struggle with Welsh, Polish or regional slang.
💡 Sentiment is the most common code and the least useful by itself. “Negative” tells you people are unhappy but not why. We’ve written more on that in sentiment alone is not a strategy.
Start with a codebook
Whoever does the coding, person or model, needs the same thing first: a codebook. For each code, write down:
- A name and a one-line definition
- What’s included and what isn’t
- Two or three real examples, plus one borderline case with the decision explained
For the cat-food project, codes might include palatability (“won’t eat it”), health or digestion, price, smell, availability, ingredient concerns and switched to a named competitor.
Create the first version by reading a few hundred posts yourself.
Check that coders agree
Before you rely on anyone’s coding, check that two coders using the same codebook reach the same answers.
The standard measure in content analysis is Krippendorff’s alpha. The usual guidance is that 0.80 or above is reliable, 0.67 to 0.80 supports tentative conclusions only, and anything lower means the codebook needs fixing before you go further.
Don’t expect people to be perfect either. In the Zurich study below, trained human annotators agreed with each other about 79% of the time when coding tweets and news articles.
What the research says about coding with AI
In 2023, researchers at the University of Zurich compared ChatGPT with crowd workers and trained annotators on 6,183 tweets and news articles. They found that:
- ChatGPT’s accuracy was about 25 percentage points higher than crowd workers’, on average
- Its answers were more consistent than both human groups: 91–97% agreement between runs, against 79% for trained annotators and 56% for crowd workers
- It cost less than $0.003 per annotation
Quicker, cheaper and more consistent. And there’s more 👇
When AI coding leads to the wrong conclusion
In 2025, a research team repeated 37 annotation tasks from 21 published social science studies, using 18 different models and around 13 million labels. They tested 2,361 realistic hypotheses to see whether coding with an LLM led researchers to the right conclusion.
With state-of-the-art models, it led to the wrong conclusion in about one hypothesis in three. With smaller models, about half the time.
The authors call this “LLM hacking”: small, reasonable-looking choices about the model, the wording of the prompt or the settings end up changing the result. They also found that with just a handful of rewordings of the prompt, “virtually anything can be presented as statistically significant.” The risk was greatest when the effect being measured was small or close to a significance threshold.
An earlier study found feeding LLM labels straight into statistical analysis caused “substantial bias and invalid confidence intervals, even with high surrogate accuracy of 80-90%.”
These findings show that a model that gives the same answer every time is consistent, but that doesn’t mean the answer is right. Arrows can land in a tight cluster and still miss the target.
[Image: two targets side by side. Left, “Consistent”: a tight cluster of arrows away from the centre. Right, “Accurate”: arrows grouped around the bullseye. Caption: “AI coding does the first well. You have to show the second.” Alt text: “Consistency versus accuracy in AI coding of social media data”.]
How to safely use AI for coding
- Write the codebook first. Give the model the same definitions and examples your human coders would get.
- Hand-code a validation sample. Take a random sample of a few hundred posts and have them coded by people who know the category.
- Check agreement for each code separately. A model can be 90% accurate overall and unreliable on the one code that matters most to you.
- Record your set-up. Note the model version, the prompt and the settings. The Zurich study found a lower “temperature” setting made answers more consistent.
- Re-check after any change. A new model, prompt or category means a new round of checks.
- Be most careful with small effects. If your headline finding hinges on a difference of a few points, that’s exactly where coding errors do the most damage.
- Keep people on the difficult posts. Sarcasm, mixed feelings and borderline cases need human judgement.
Step 6: Analyse people, not posts
You now have clean, coded data. The temptation is to count posts and call it a result. Here are some reasons why you might not want to do that ⬇️
Count people, not posts
Remember the 10% who write 80% of posts. If one frustrated owner posts 40 times about the new recipe, a post count makes “smell” look like a major issue: a person count shows it’s one very unhappy customer.
Pew’s methods team reports social media findings per user and uses medians rather than averages for exactly this reason. Do the same by removing repeat posts from the same author before you calculate percentages, and checking whether any single author, or small group of authors, is driving a theme.
Compare against a baseline
A spike in complaints means nothing until you know what’s normal. Pull the same query for the same months last year and for the months before the change. For the cat-food project, did “won’t eat it” complaints actually go up after the recipe changed, or were they always there?
Report themes, not just scores
A net sentiment score summarises your coding. It isn’t a finding in its own right. The finding is in the themes: what people talk about, how they describe it and what they compare it with.
In the cat-food example, the difference might look like this (the numbers are illustrative):
❌ “Net sentiment fell 12 points after the recipe change.”
✅ “After the recipe change, a much larger share of posting owners said their cats were refusing the food, and most of those posts mentioned the smell. Mentions of price stayed about the same.”
Check against other sources
Social data rarely works best on its own. Test your findings against:
- Survey or tracker data. Do the two point the same way?
- Reviews. Do verified buyers say the same thing? See how to map the full customer voice by combining social and review data.
- Behavioural data. Did repeat purchase fall in the same regions and channels?
When sources that go wrong in different ways agree, you can say so with confidence. When they disagree, that’s often the most useful finding in the whole project. Reviews are especially good at this kind of early warning; our guide to spotting churn signals in reviews shows what to look for.
The same method works beyond your own brand, too. Swap the research question and you have a way into competitive intelligence that’s based on customers’ own words.
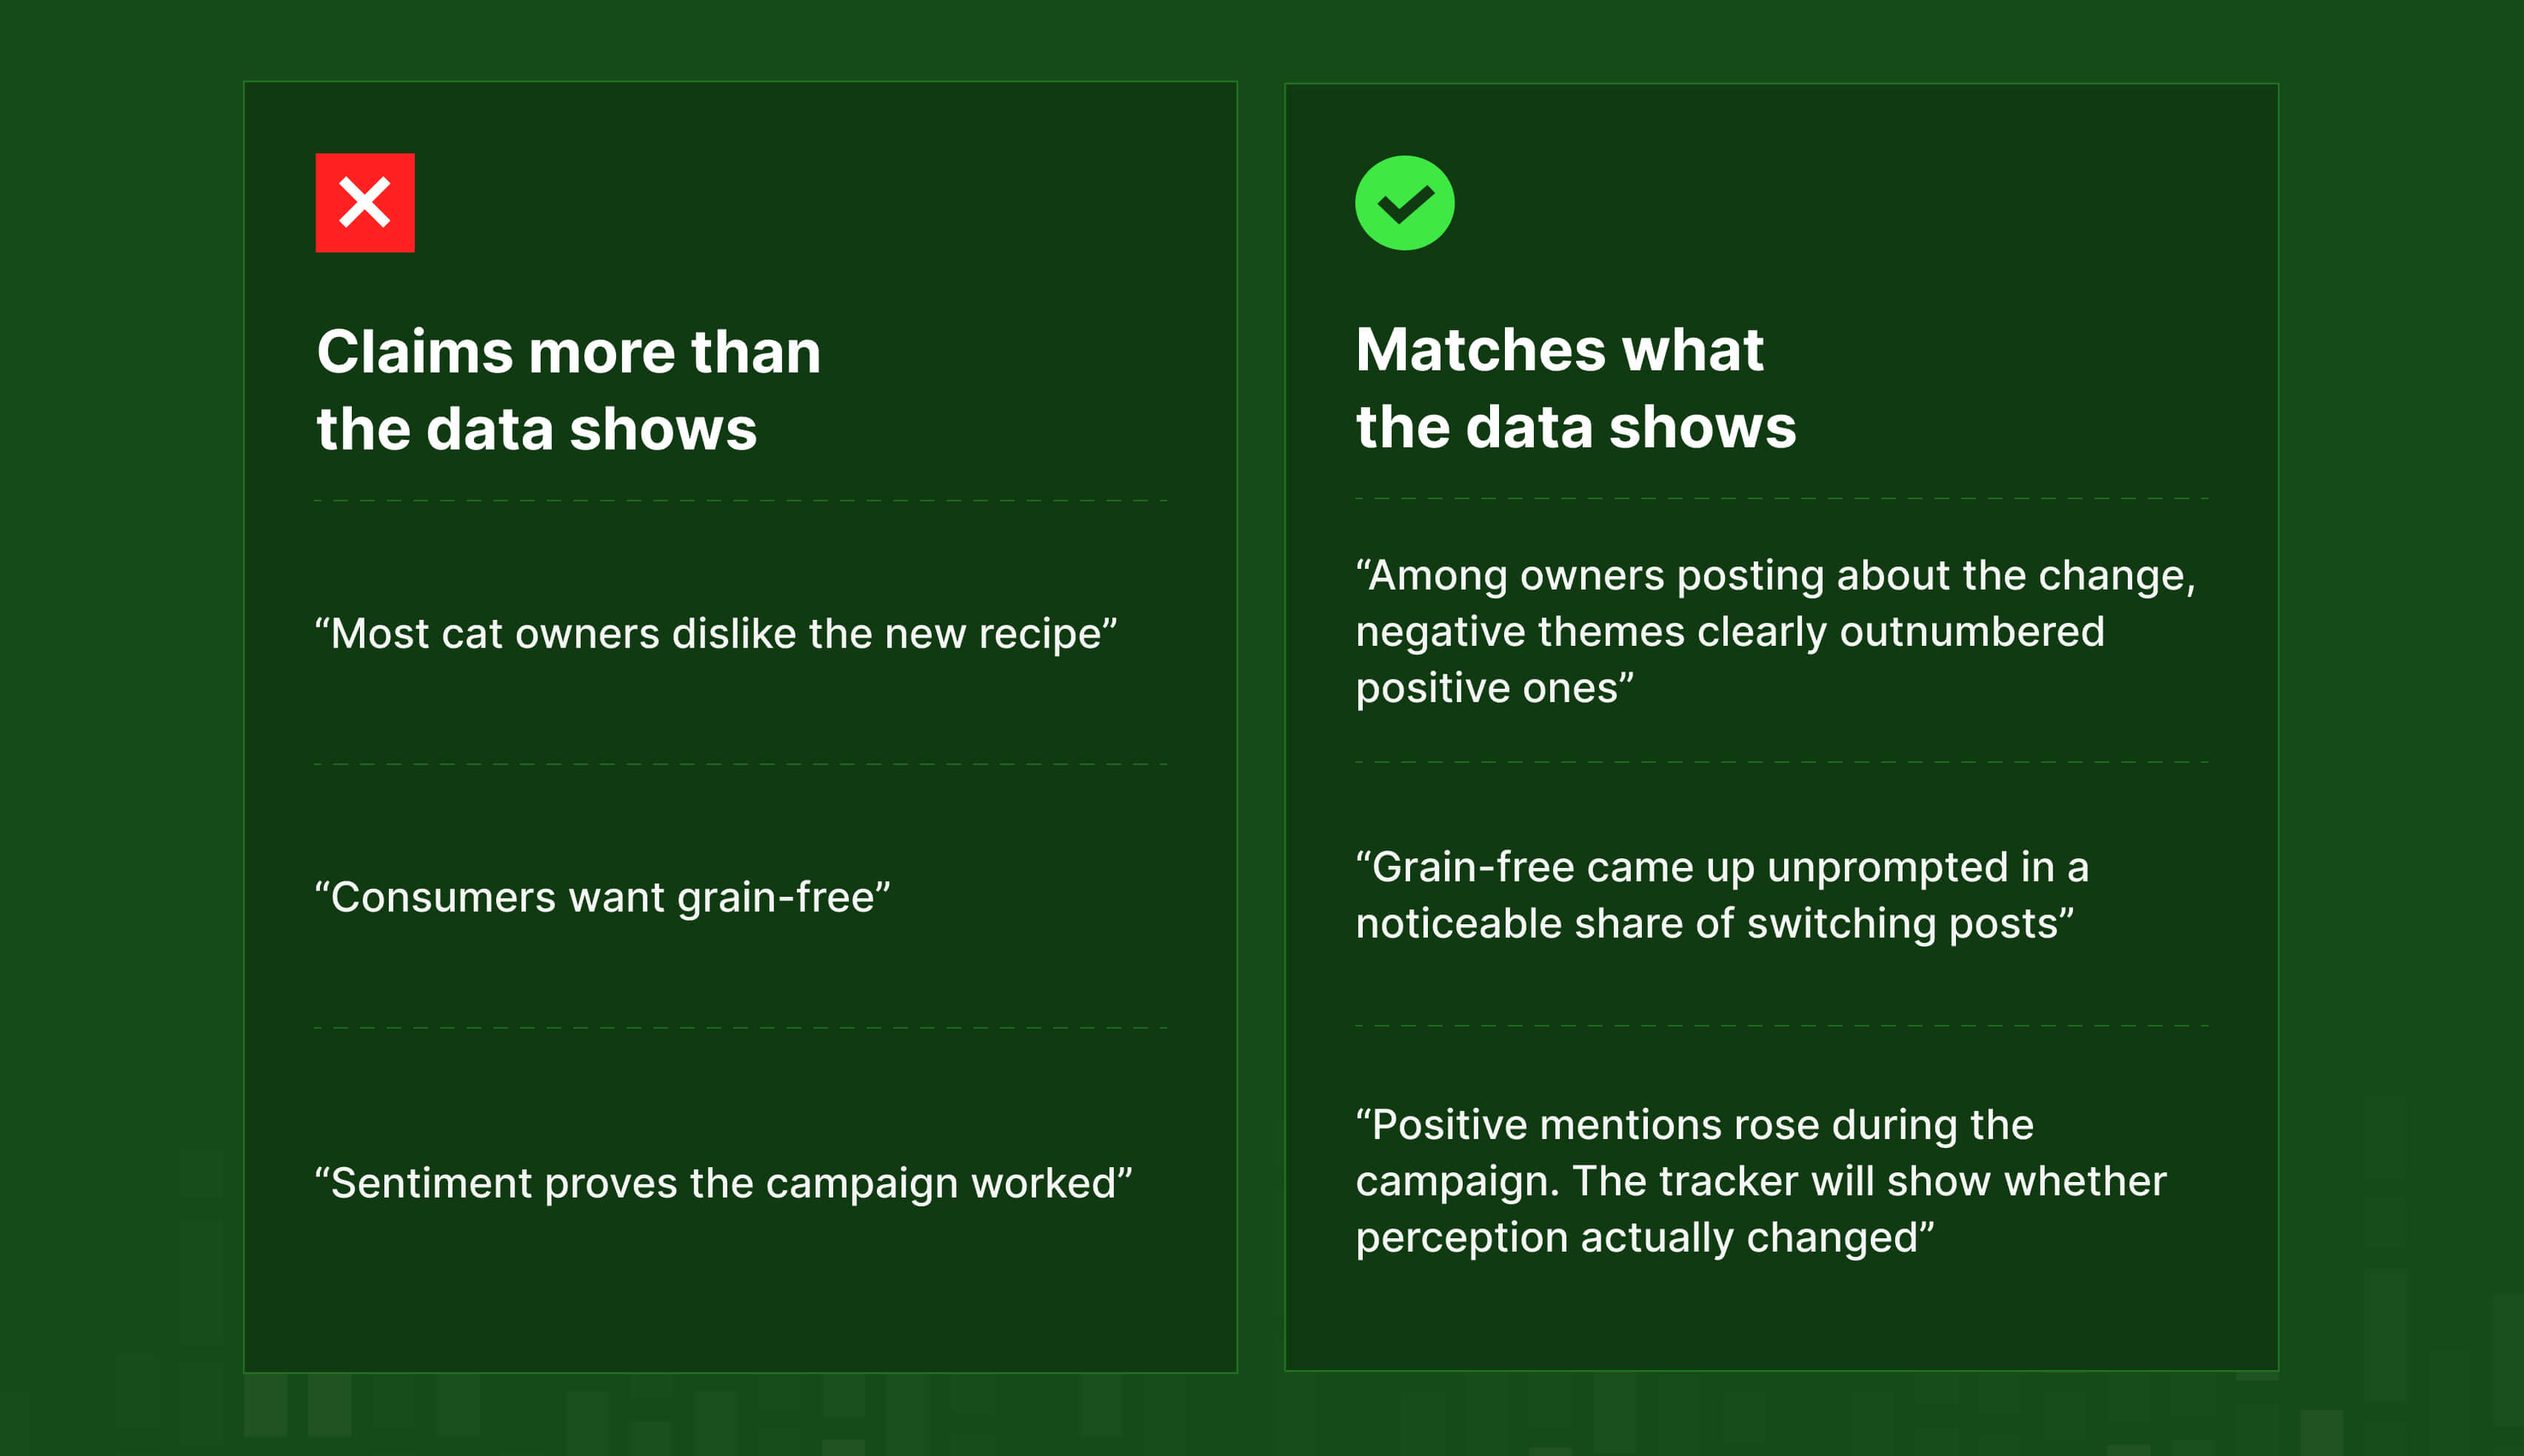
Match your wording to your evidence
These examples are illustrative:
Step 7: Write a method note
Every survey report has a methods section, whereas you see social listening reports limited to a chart and a date range.
A short method note turns a dashboard into evidence, and it protects you when someone asks an awkward question in the readout.
Social listening method note checklist
☐ Research question and hypotheses, written down before the analysis
☐ Sampling frame: sources, content types (posts, comments, reviews), languages, countries and dates
☐ Known skews: which groups are likely to be over- or under-represented
☐ Query logic, with estimated precision and recall
☐ Cleaning log: the rules applied and how many items were removed
☐ Codebook: a summary, and how it was developed
☐ Coding method: human, AI or both, including the model version and prompt if AI was used
☐ Agreement: the size of the validation sample and agreement for each code (e.g. Krippendorff’s alpha)
☐ Unit of analysis: people or posts, and how heavy posters were handled
☐ Baseline used for comparisons
☐ Other sources checked, and whether they agreed
☐ Limitations: what this data can’t tell you
What can’t social listening tell you?
Social data is a strong research input with hard limits. It won’t tell you:
- How many people hold a view in the wider population, only how that view is spread among the people who posted
- What non-posters think, which covers the majority who read but never write
- What people do in private, in closed groups, messaging apps and offline conversations
- Sensitive or unfashionable opinions, which people often keep off public platforms
- Why someone stayed quiet. A lack of complaints doesn’t mean people are satisfied.
Use social data alongside other methods, and to write the method note.
Surveys have blind spots too. Pew’s telephone survey response rates fell from 36% in 1997 to 6% in 2018, although Pew also found that low response rates didn’t automatically make its polls less accurate. Every method has gaps; good research combines methods whose gaps don’t overlap.
Where does the data layer fit?
Look back over the seven steps. Every one of them depends on the data you start with:
- Step 2 needs you to know which sources and content types are in your dataset
- Step 3 needs enough coverage to reach high recall
- Step 4 needs author IDs, timestamps and thread context to remove duplicates and spot automation
- Step 5 needs the full text, including posts and the comments underneath them
- Step 6 needs history for baselines, and author-level data so you can count people
A good method can’t make up for a thin dataset. If comments are missing, history stops at 30 days, or half the data comes from one source, careful coding won’t put that back.
You can get that strong, accurate data input with Datashake. We provide structured social and review data (posts, comments, reviews and their metadata) through a single API, so your team can run its own method on top, without a black-box dashboard in the way.
Key takeaways
- Social data is found data. Your job is to add the research design afterwards.
- Start with a question, not a keyword list.
- Define your sampling frame and keep your claims within it.
- Measure your query with precision and recall, and report both.
- Clean before you count, and keep a log of what you removed.
- AI coding is consistent, but that doesn’t make it correct. Check it against a human-coded sample, one code at a time.
- Count people rather than posts, and always compare against a baseline.
- Write the method note. It’s what turns a chart into evidence.
💡 Surveys tell you what people say when you ask them. Social data tells you what they say when nobody’s asking. A sound method tells you how far to trust each one. Book a call to see what your research questions look like with complete social and review data behind them, or download the 2026 Social Data Coverage Report.




More insights you might like


%20thumbnail.jpg)
.png)